Project Profile
Project profile consists of several tabs depending on the user’s role. Tabs also link to further subsections of the profile. Breadcrumbs below the Portal’s top bar allow to go from any subsection to any higher-level view all the way up to Projects.
Project’s pictogram and link to its HMI are shown to the left. These are shown in all tabs. Pages listed below describe each a tab of the profile:
General
This tab presents the following information about the project:
- Project name
- Project ID (click to copy the ID value)
- Scale flair (small, medium, or large)
- Address
- Project type
- Groups that the project is a member of, see Groups for details
- Server that hosts the project and its IP address (hidden by default). Server name is also a shortcut to the server's page under Servers.
Pages
Main article: Pages
A page is an interactive screen that presents selected information on its related project. This information may include sensor readings, schematics, or other visualizable data. Pages update in real time where applicable.
This subsection lists all available pages of the project. Each page has a name and date created. Select a page to download it as a file1 or create a template based on it. Alternatively, a template can be created by clicking on to the right.
Documents
Read available documents and download .pdf files in the menu. The following options are available:
-
Click a checkbox to the left from the document to add it to the pick. You can select all the files by clicking the box above the item list. -
There are two ways to add items to a subsection. You can add a single document by clicking on . Click on to add multiple `.pdf` documents. -
Select documents you need to export and click on in the actions panel above the document list. -
Click on to create a new folder. To rename a folder, open it and click on button.
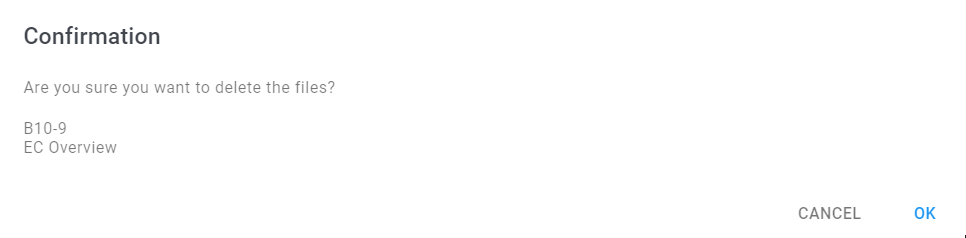
Fig. 1. Confirmation window example
The set of available options depends on Permissions.
There are two ways to add documents to a project:
-
Upload a PDF file. -
Enter a link to a PDF file.
You can choose one way or another in the menu.
Tags
Main article: Tags
Alarms
Main article: Alarms
Preferences
Main article: Preferences
Third-Party settings
Main article: Third-Party Settings
KPI
The KPI tab is a list of KPIs associated with the project. You can associate project tags with KPIs, if you have project administrator credentials.
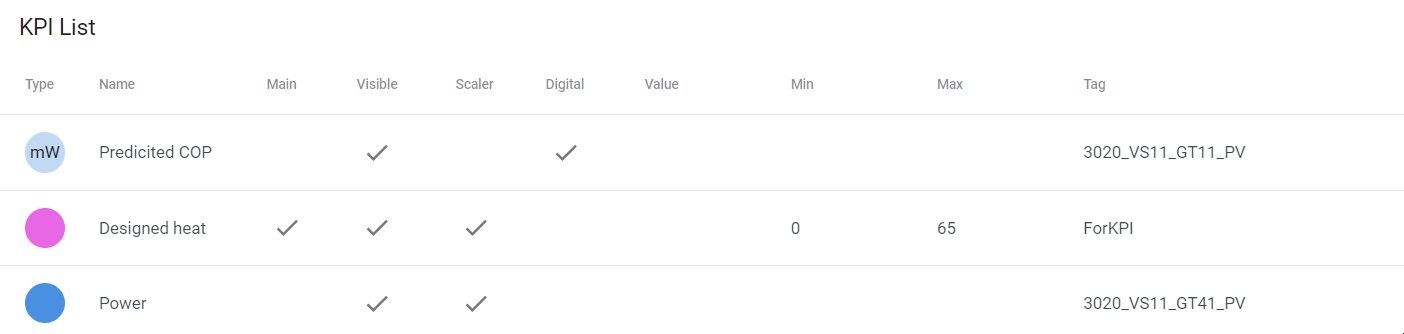
Fig. 2. Project KPI tab
A KPI is an essential performance parameter defined by the project type. KPIs display the associated tag values that project or Portal administrators can configure in the KPI tab of the project profile.
You can associate a tag with each KPI in the editing mode. Click on to pick a tag from a page. It is possible to choose the tag in the tag list: click on for that.
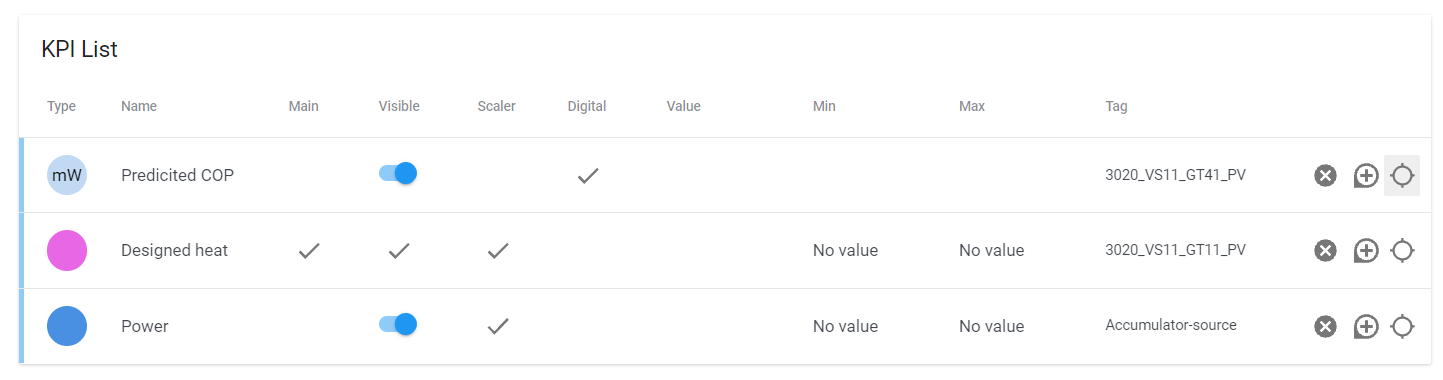
Fig. 3. You can change visibility of some KPIs and associate tags with them.
KPIs in Portal help you to monitor important information about projects. Each view of the Projects section displays KPIs differently.
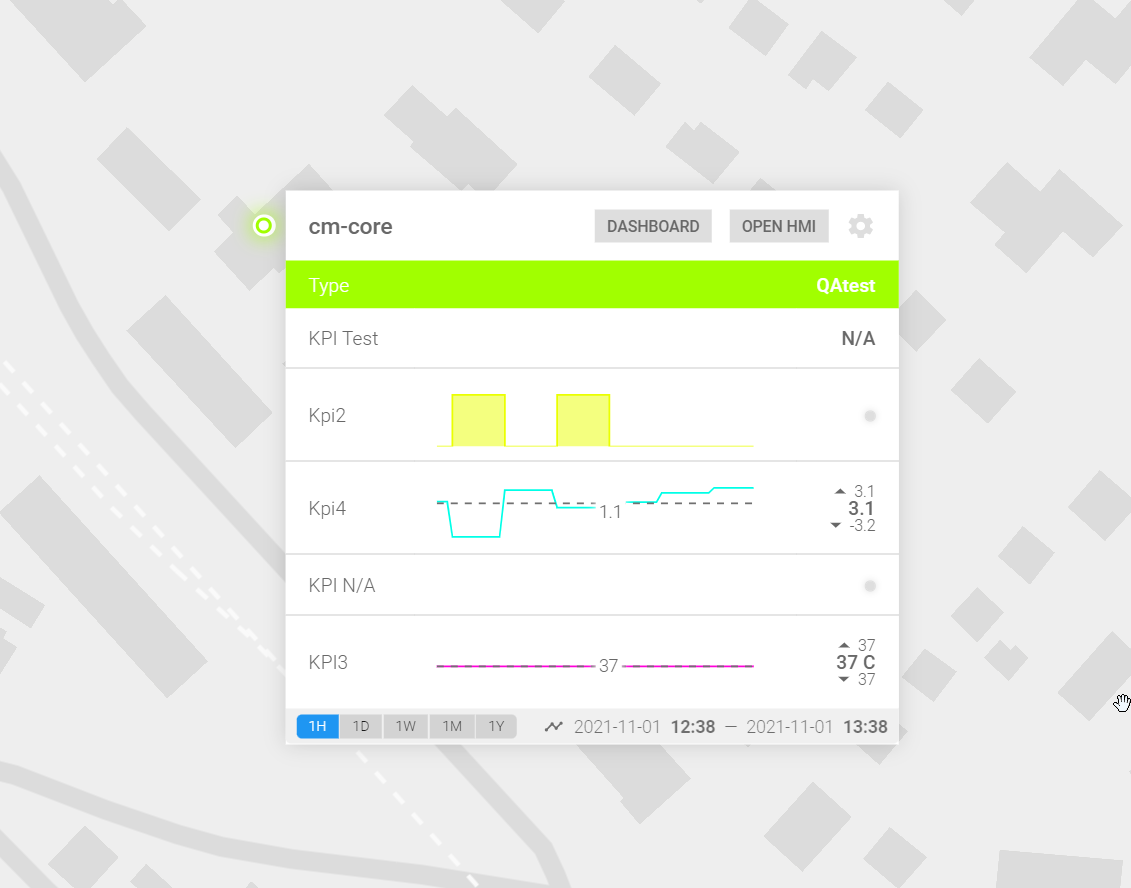
Fig. 4. Click the project's marker to expand the KPI pop-up in the view
The KPI pop-up also contains redirecting buttons that allow you to open an HMI instance and an external dashboard. You can change the display periods if tags associated with KPIs have historical data. The buttons are placed at the bottom of the KPI pop-up, as in the figure above.
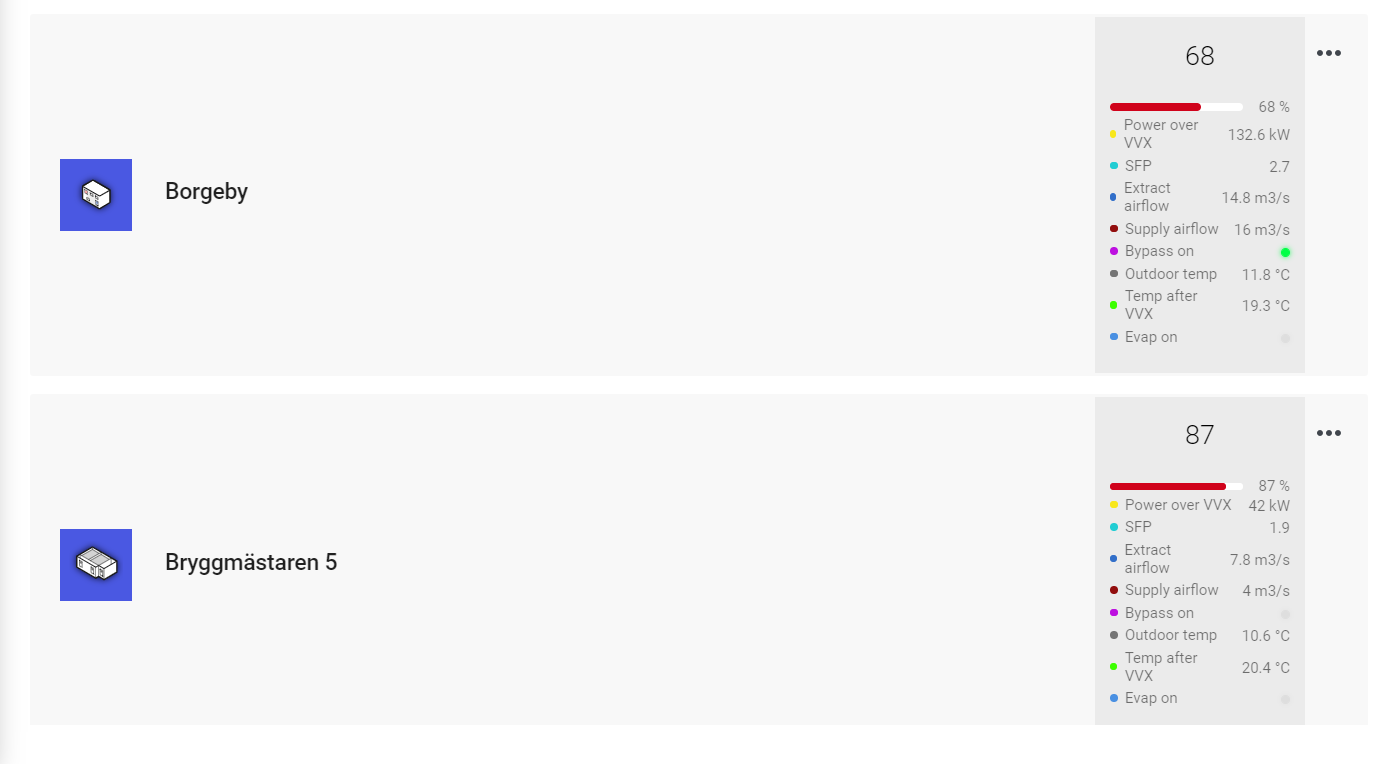
Fig. 5. The view places KPIs on the right side of the screen
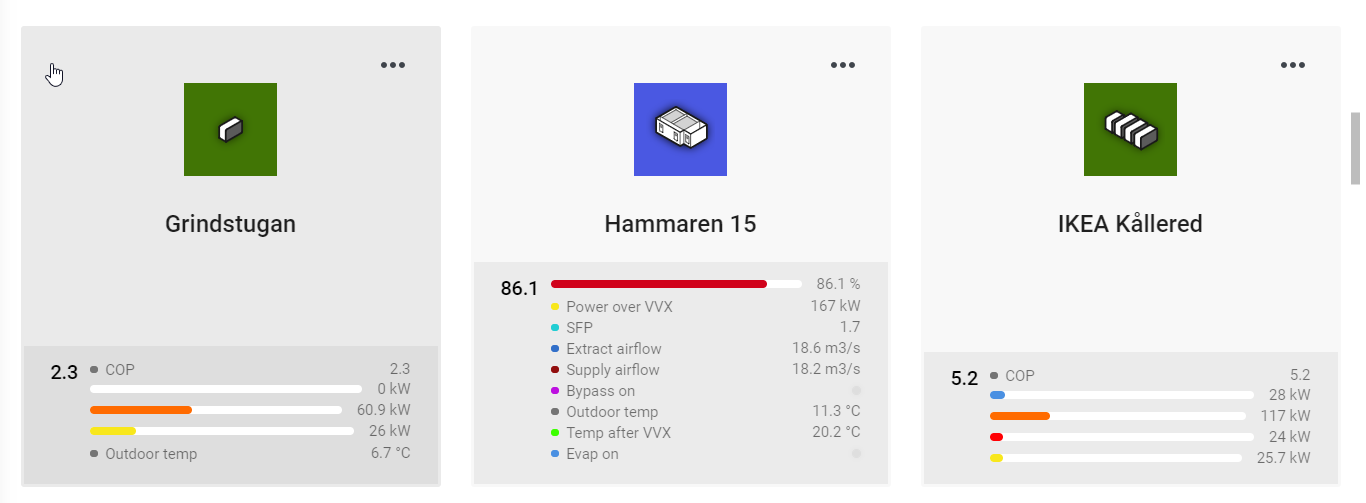
Fig. 6. In the view, you can find KPIs under the project name
Dashboard
This section overviews a feature that is currently in development and might not yet be available in the stable release version.
To create a dashboard, navigate to → → . A dashboard may consist of several pages which consist of up to four different components per page.Components
- Text components:
- Title component: Short, up to 50 characters long title
- Description component: Up to 250 charcters long description about your project, chosen widgets etc.
- Widget components:
- Bar chart widget: As a default offers “Efficiency” chart to be displayed.
- Bubble chart widget: As a default offers “Savings in CO2 emissions equivalent” chart to be displayed.
- Line chart widget: As a default offers “Savings on building’s operation” chart to be displayed.
- Pie chart widget: As a default offers “What is powering this bulding?” chart to be displayed.
All components are editable and adjustable to your project(s) needs.
Single Project Dashboard
Suitable for users who have only one Energy Machines™ project (or only one project needs a dashboard):
- Click on to open the dashboard wizard. Enter the desired name, choose a project, and click .
- Proceed to type the page name and choose a layout for the first dashboard page, then click again.
- Now choose the components and upload an icon for your first dashboard page. Once ready, you can either or if the dashboard needs no more pages.
Multi Project Dashboard
By choosing this option under Dashboards, you will be able to add information about your multiple projects into one dashboard. Compare, highlight, display different aspects of your projects!
Permissions
User roles define actions that a user is able to perform in a project. All the roles are managed by the administrator of the Portal. Any Portal project can have users with the following roles:
- Admin
- Manager
- Viewer
- No roles
- IDE
The user roles of the Project can be viewed under the Permissions tab.
Permissions are granted for several areas of the application:
- HMI
- Mobile App
- Portal
- Local HMI
Animated screenshot below demonstrates the simplicity of handling roles. We add a user group and give it permissions in all the areas of the application.
Fig. 7. Project permissions
Tables below show role-specific permissions in different categories.
Table 1. Portal permissions: breakdown by roles.
| Cloud components | Available actions |
|---|---|
| General project information KPI table Mobile tab Settings |
View, edit |
| Pages Documents |
View, export, import, create, edit, rename, delete, manage permissions |
| Devices and tags | View, copy IDs, import, export, create, edit, rename, delete, manage permissions |
| Reports | Create, edit, rename, delete |
| Personal profile | Edit |
| Project preferences | View, edit |
| Third-party settings | N/AView, edit |
Table 2. HMI permissions: breakdown by roles
| Cloud components | Available actions |
|---|---|
| Pages | All available actions |
| Alarms | View, acknowledge, shelve ❗Availability of alarm-related actions is tied to category-based permissions; see Category Permissions. |
| Trends | |
| Logs | |
| Documents | |
| Events |
Users with admin and manager roles have access to IDE functionality. Users with the viewer role can also be able to work in IDE. Portal administrators can grant permission to such users.
In case Pages, Alarms or Documents are not visible to you, access to those items has not been shared. In case you need access to other content, contact your Portal admin to get the right access.
Anonymous Local HMI user
Local HMI instances can have a user that does not have an email registered in the Energy Machines™ system. Such user is called anonymous.
In the Permissions tab’s editing mode, click on and type anonymous in the filtering field. Appoint a role for the anonymous user. After that, you can manage permission concerning pages, documents, tags and alarms via the contextual menu.
Mobile
Each user that has at least mobile viewer access to a project will see the KPI assigned to that certain project. A user with the right access can modify the projects mobile view of certain project tags. In case more tags are wanted to be viewed in the app, these are added in the portal under the tab.
Animated screenshot below shows how to modify the custom tags and removing one of the custom tags, EMB01/EMB_EM1_Power. The modifications are done in the Portal but will be visible in the mobile application.
Fig. 8. An example of how to modify personal mobile tags.
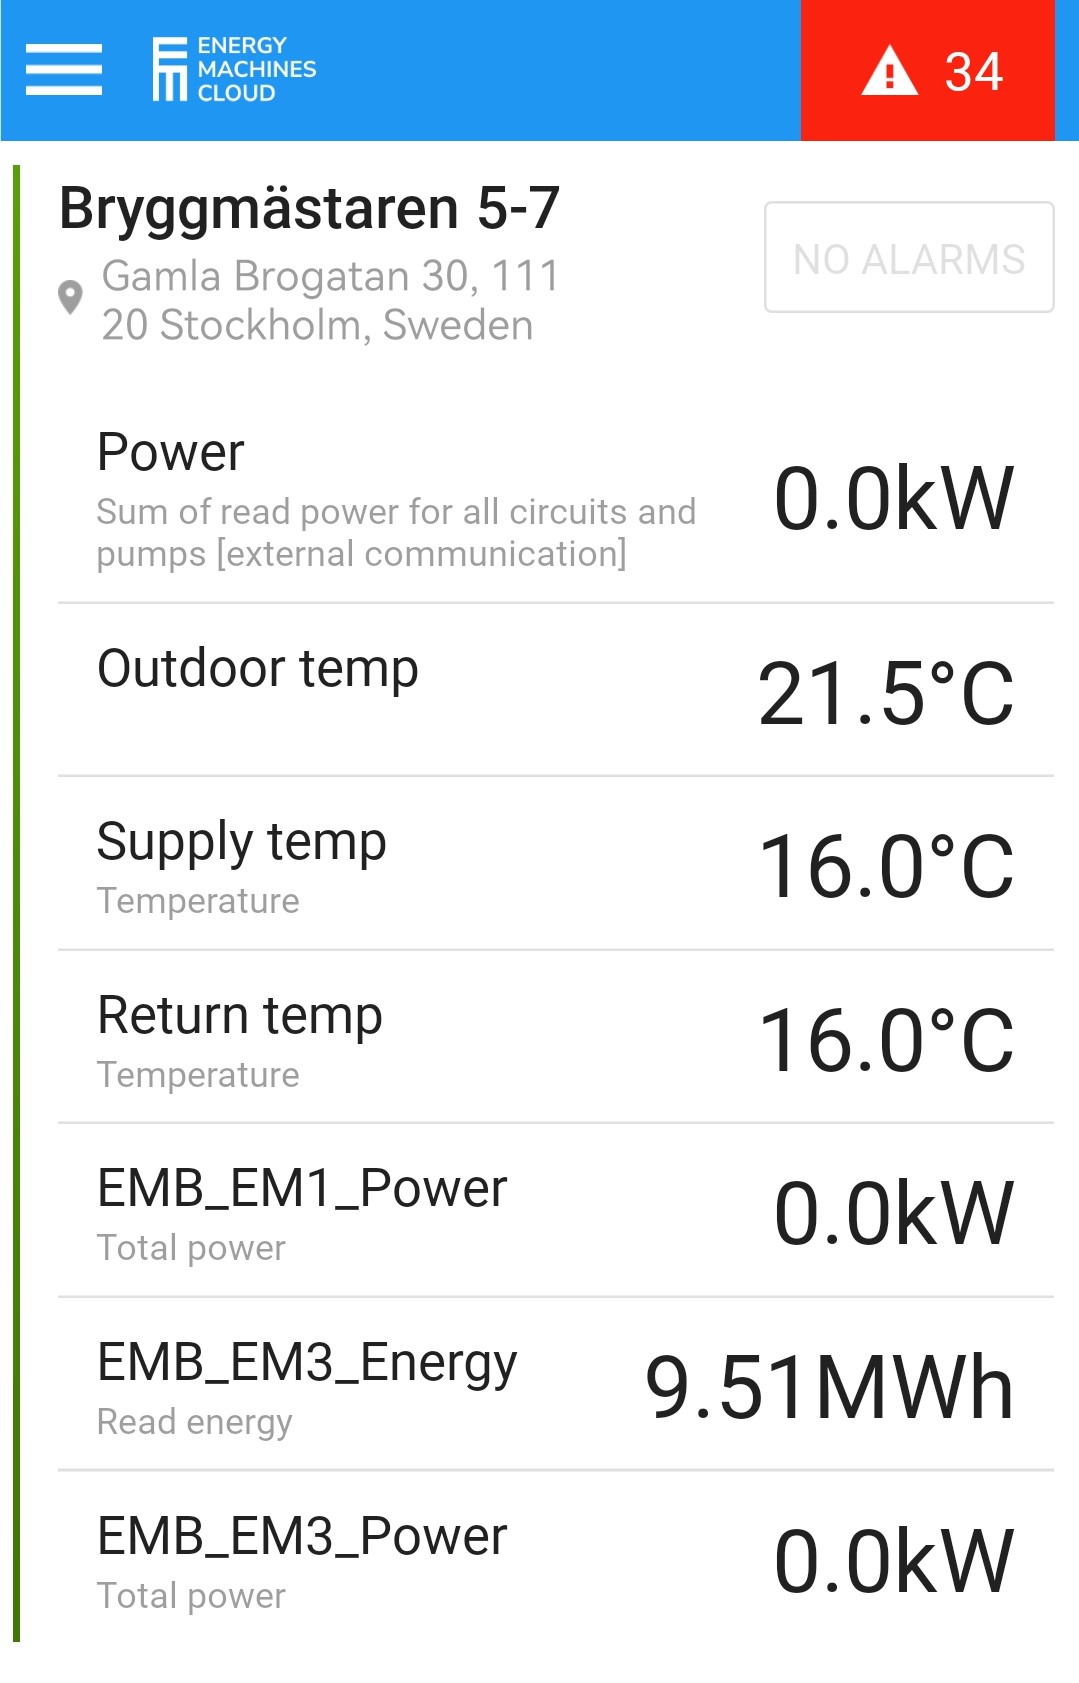
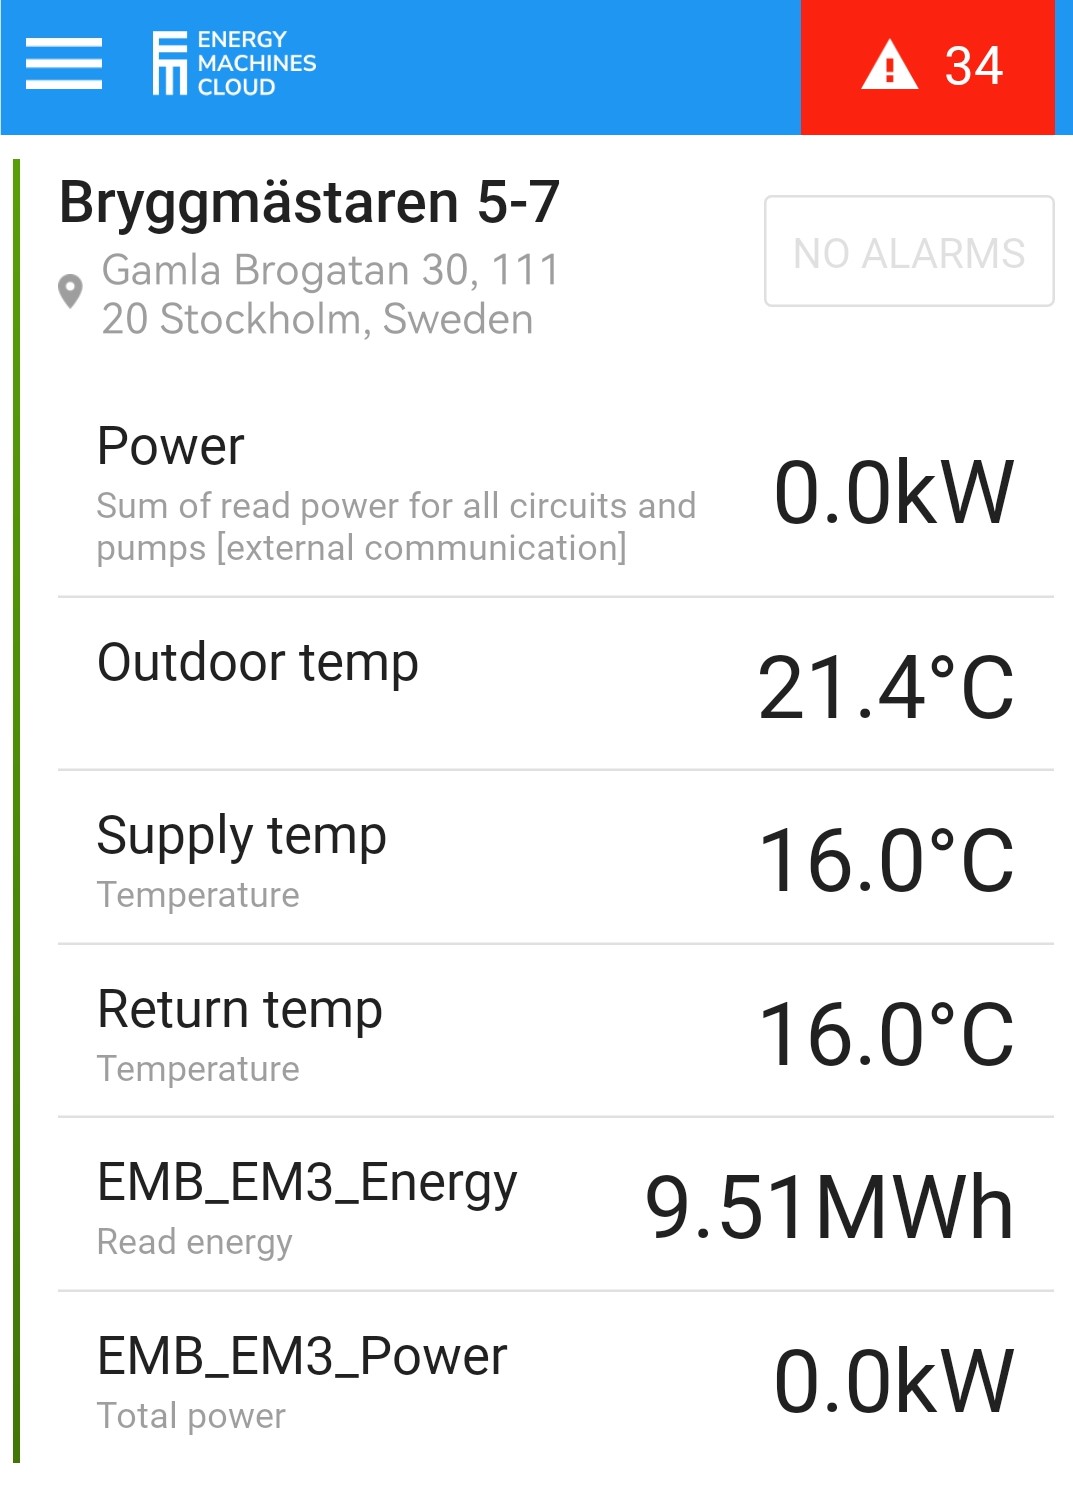
Figure to the left shows what the user would see in the app before the custom tag has been removed from the Portal. Figure to the right shows what the user would see in the app after the custom tag has been removed from the Portal. The tag EMB01/EMB_EM1_Power is no longer visible in the app.
This action downloads an SVG copy of the page’s graphics but none of the applicable data. ↩