Alarms
This interface partially overlaps with HMI » Alarms.
Provides an overview of alarms in projects where the user is authorized to view alarms.
Fine-grained access control can be applied to determine which alarm categories the user can see and/or interact with in a project; see Category Permissions for details.
The interface is three-tabbed:
View Controls
Views controls determine the scope of presented information; they can be found under the tab ribbon across all tabs. Some of the settings are tab-specific.
The following view controls are available:
Timespan
Selects the timespan to show data from. Records of alarms triggered outside the timespan will be excluded from displayed data.
The timespan is defined as the period between two points: From and To. Click on either field to open a datetime picker and specify the exact date and time.
Alternatively, timespan shortcuts 1H, 1D, 1W, 1M, and 1Y can be used to set the timespan to one hour, 24 hours, 7 days, one month, or one calendar year preceding the current time, respectively. Shortcut ALL sets the timespan to be between the datetime of the first recorded user-accessible alarm and the current time.
Some tab-specific considerations apply:
Select projects
List of projects the user has access to, in collapsible groups. Filter field available. All projects the user has access to will be listed; however, project-specific permissions will affect alarm visibility, see note above.
Other settings
Provides up to three filters:
-
(not available in Real Time)
Maximum number of shown alarms as sorted in descending order by combined activity length. For example, setting the value to5will only show the 5 longest-active alarms in the selected period under Alarms by the activity length and Top. -
Selects alarms by priority. Selected priorities have a darker background; by default, all priority levels are selected. -
(not available in Real Time)
Check to apply color-labeling to charts. This will transform charts under Alarms by priority (and , which shares the same data model) into stacked bar charts with the following priority-specific colors:LOW PRIORITY,MEDIUM PRIORITY,HIGH PRIORITY. Disabled by default. -
Selects or deselects alarm categories to show data on, with a filter field for convenience. Only categories the user has access to are listed, see note above.
Real Time
Lists unacknowledgedSee Actions alarms in a tabular format; temporal filtering applies if enabled ().
Statistics
Provides a summary of alarm statistics over the selected timespan.
Alarms by priority
Shows the total count of alarm activation events over the selected timespan as a bar chart or a multi-color stacked bar chart if priorities are shown. One chart is generated per project.
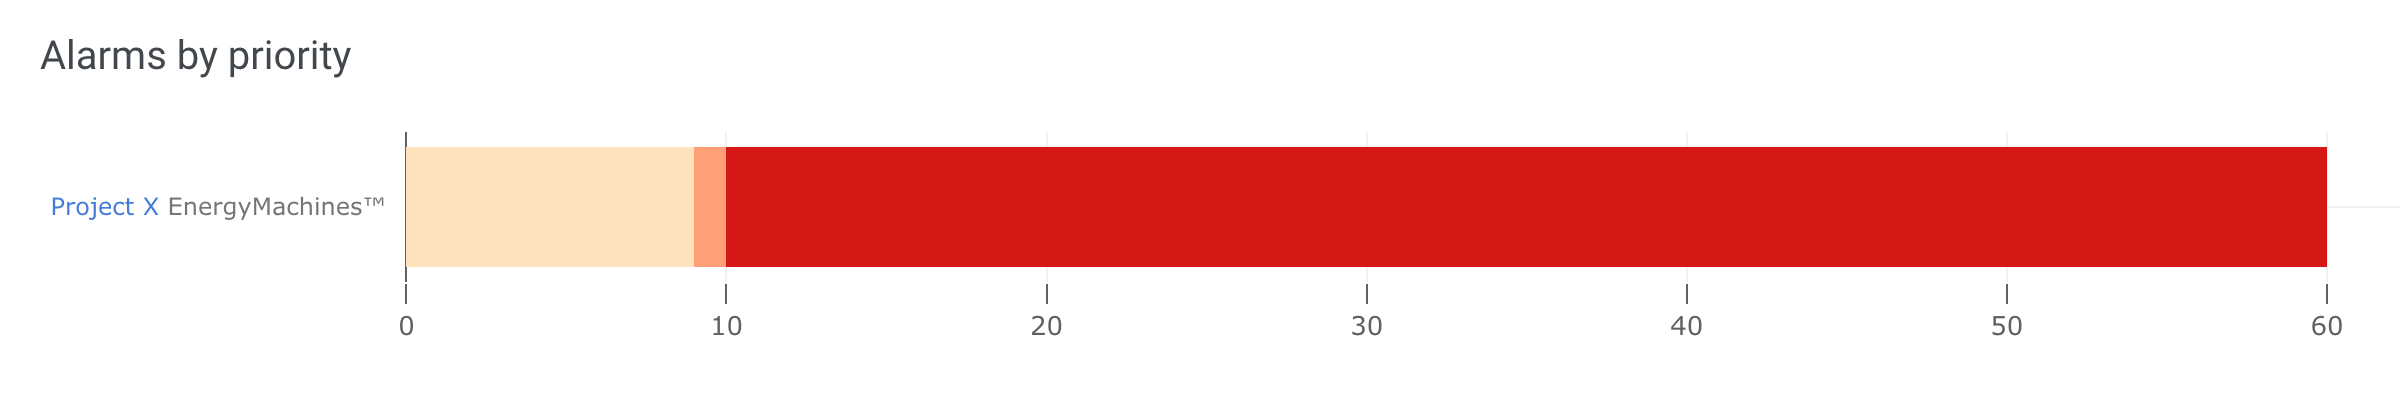
Fig. 1. Alarm counts by priority over one month.
In this example, 50 out of 60 activation events were attributable to HIGH PRIORITY , one was a MEDIUM PRIORITY alarm, and nine had a LOW PRIORITY .
Alarms by the activity length
Shows $X$ alarms with the longest combined active time, where $X$ is the total top values. The selected timespan is spread on a timeline where non-zero bar height indicates the timespan(s) of the respective alarm activity.
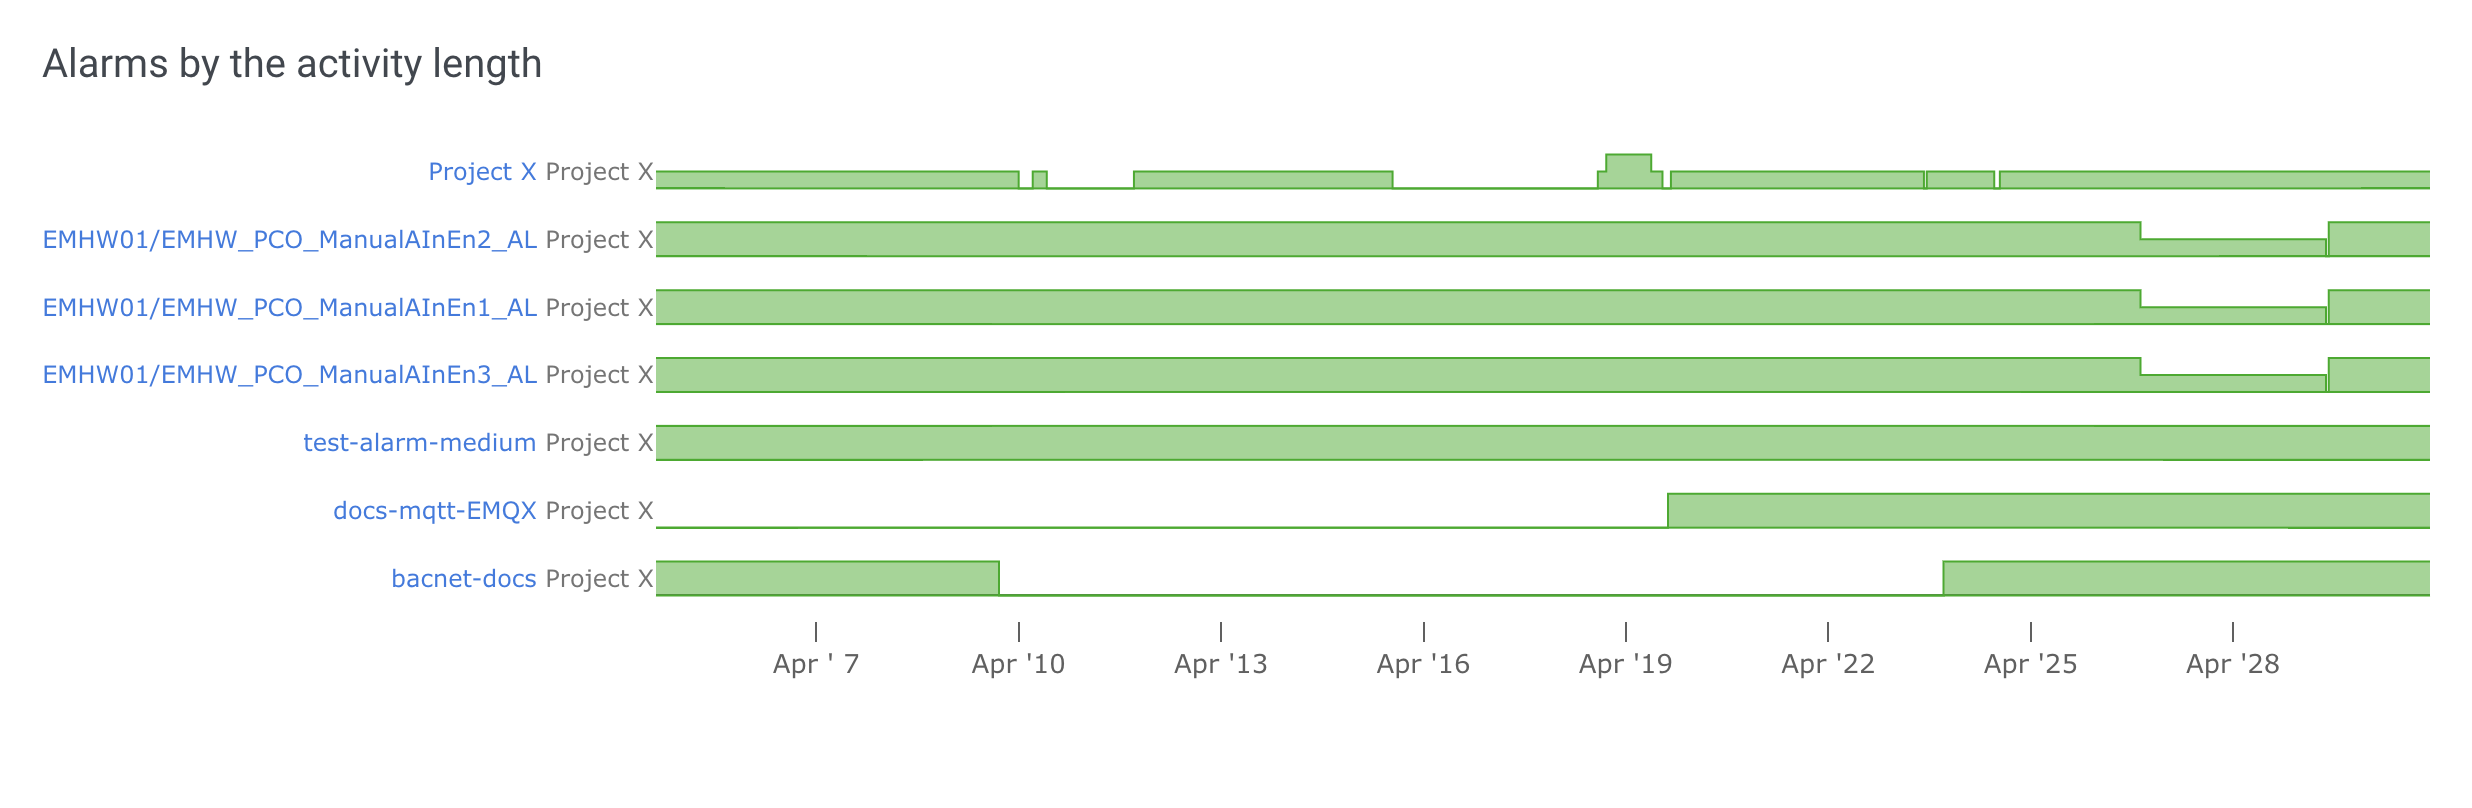
Fig. 2. Alarm activity over one month.
In this example, bacnet-docs is an alarm that was active roughly between April 1st and April 9, then from April 20 until the end of the month.1
Alarms by the activation periods
Shows alarm activation statistics on a column chart, each column representing the alarm activation count in a given subperiod of the selected timespan. Each subperiod corresponds to one hour/day/week/month, depending on the duration of the data sampling timespan.
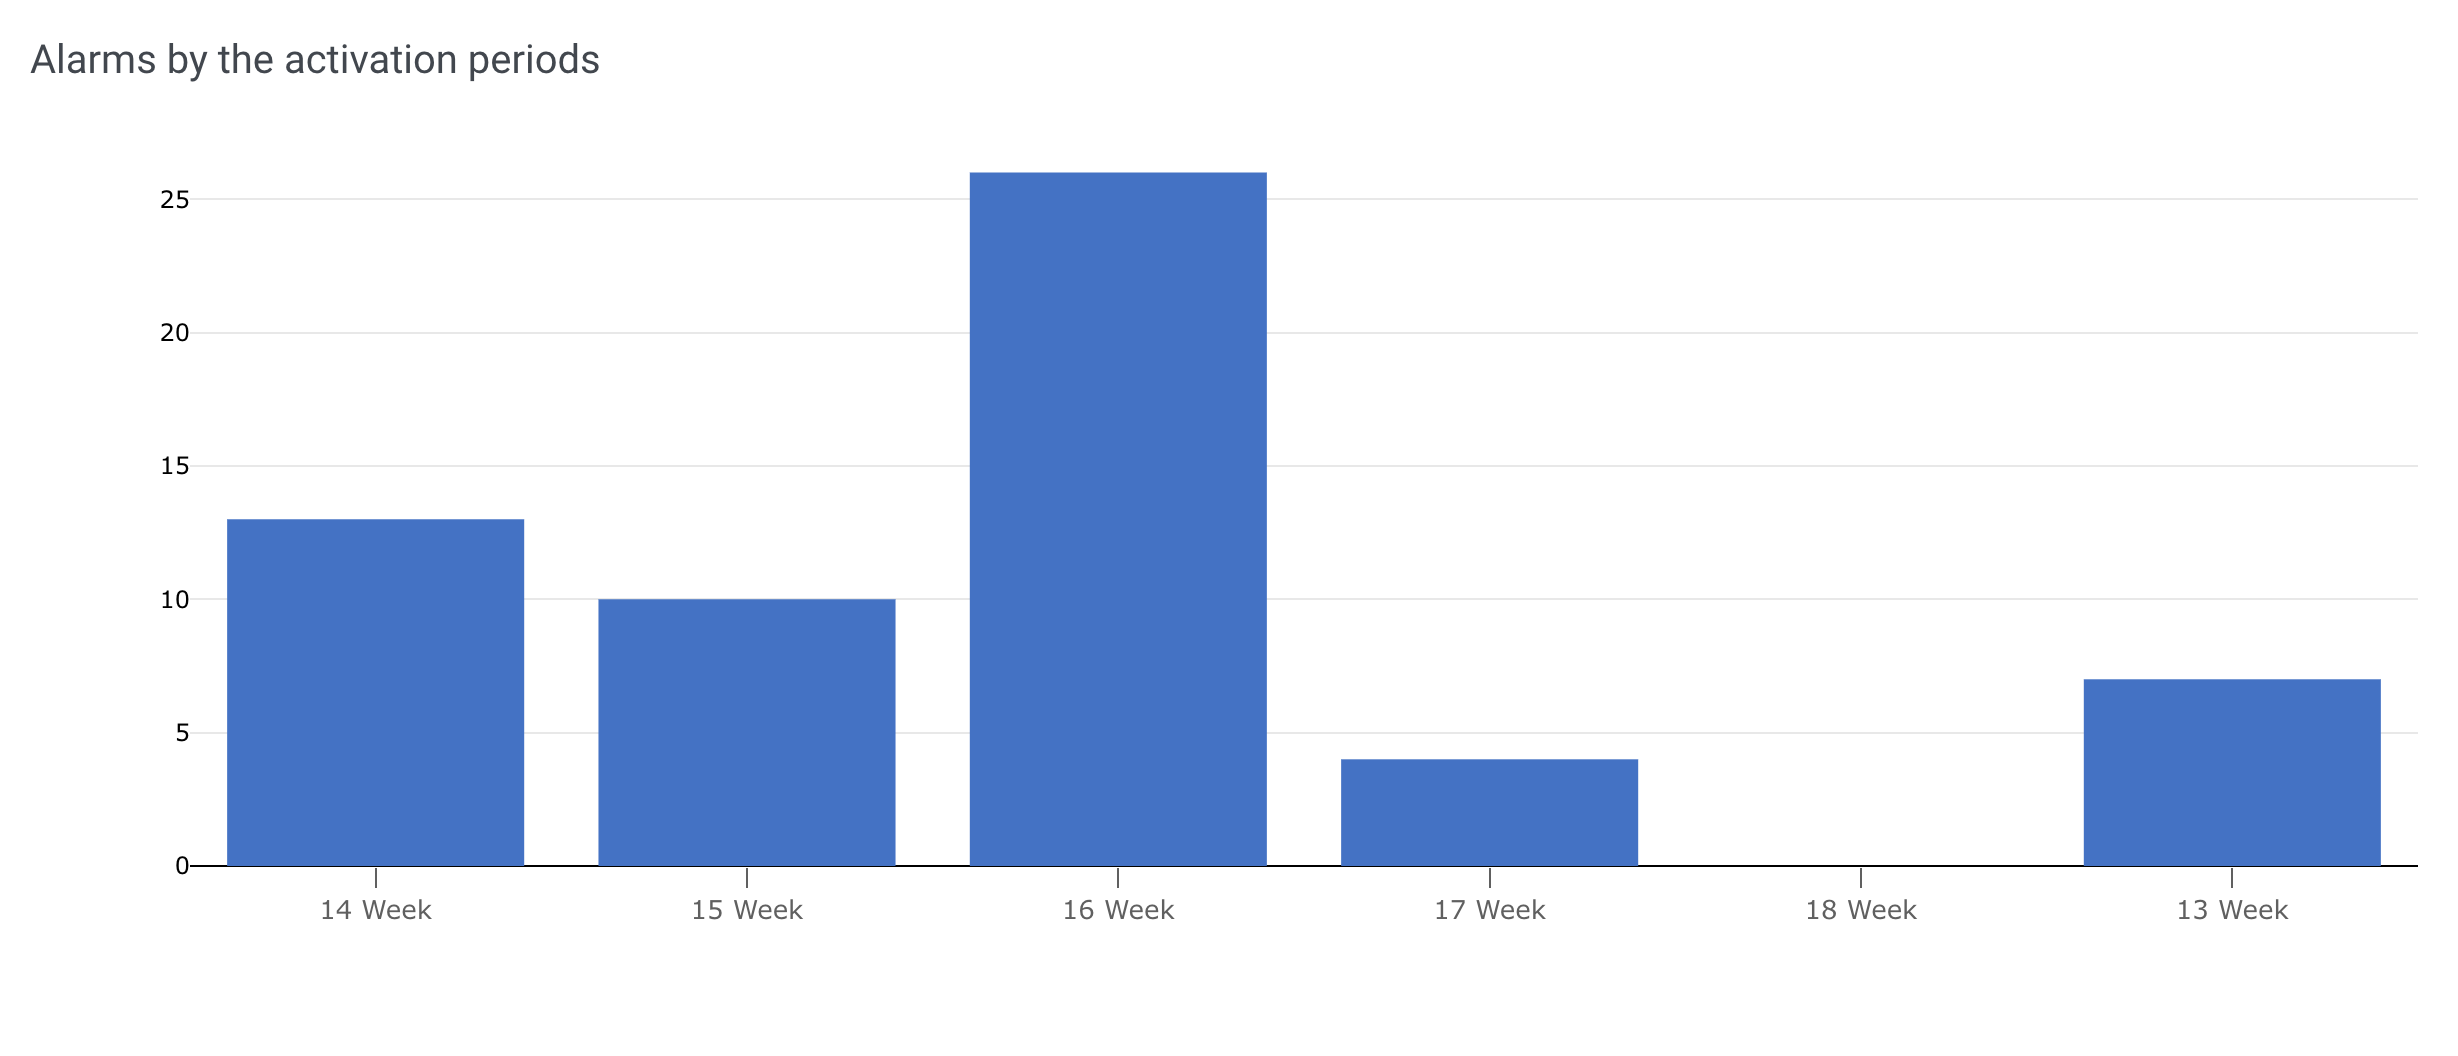
Fig. 3. Alarms activation counts over one month.
In this example, 16 Week (April 15-21) had the highest count of alarm activation events of — 26, see Y-axis labeling for scale.
Alarms by categories
Shows the following statistics on alarms in the selected timespan:
- Total count of alarm activation events
- Combined active duration of all alarms (might exceed the length of the selected timespan)
- Breakdown by category, with activation count for each (nominal and % total)
- Category-colored pie chart
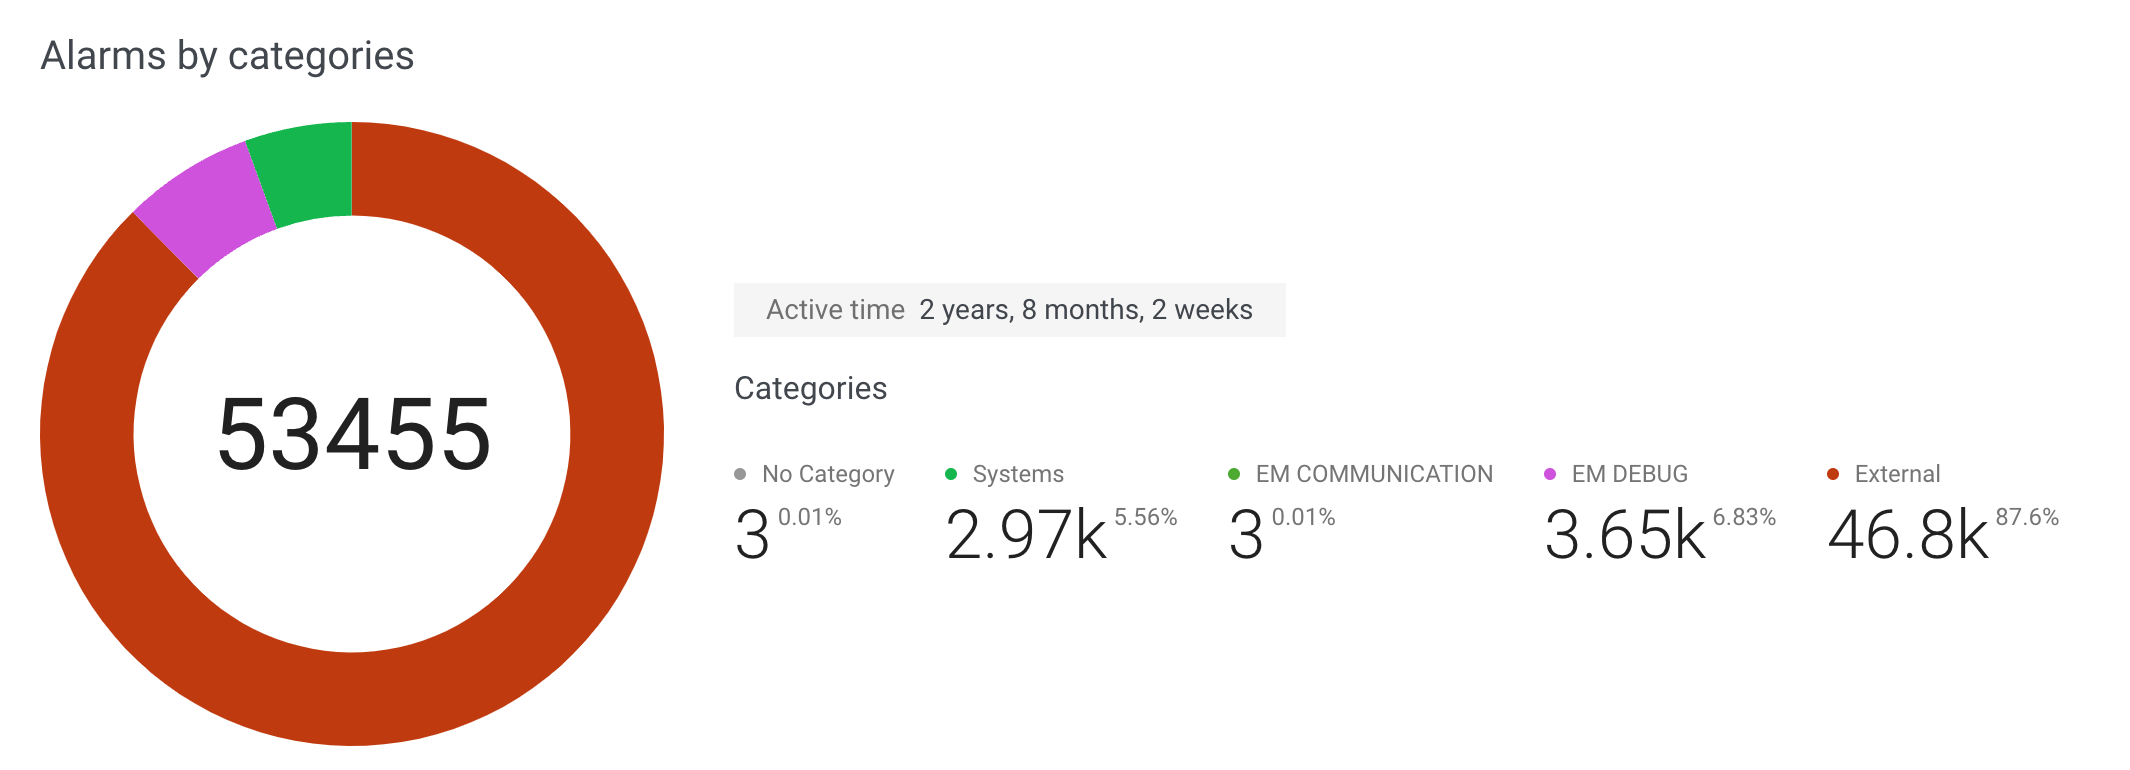
Fig. 4. Alarms by categories over one year.
In this example, category Systems accounts for nearly 61% of all alarm activation events. All alarms combined were active for 2 years, 8 months, and 2 weeks.
Subscribe
For subscription management, see Subscriptions.Opens alarm subscription dialog. Subscribed users receive regular reports on alarm statistics by email.
-
Name of the newly created subscription, under which it will be listed in managed subscriptions. Subscription name is also used in the email subject. -
Reporting frequency, with the following options:-
Daily— Every day of the week that is checked in the bar below; all days are checked by default. -
Weekly— Every week on the day that is checked in the bar below; Monday by default. -
Monthly— Every month on the day selected in the dropdown below. -
Yearly— Every year on the date selected in the dropdowns below (day and month).If the selected day (or DD/MM) is ahead of subscription date, the first report will be sent the same month (year). Otherwise, the first report will be sent the next month (year).
-
Hours and Minutes specify the report generation time. The report will provide data sampled over the timespan equal to its interval and immediately preceding the report generation time.
Reports are attached as .pdf or .csv files.
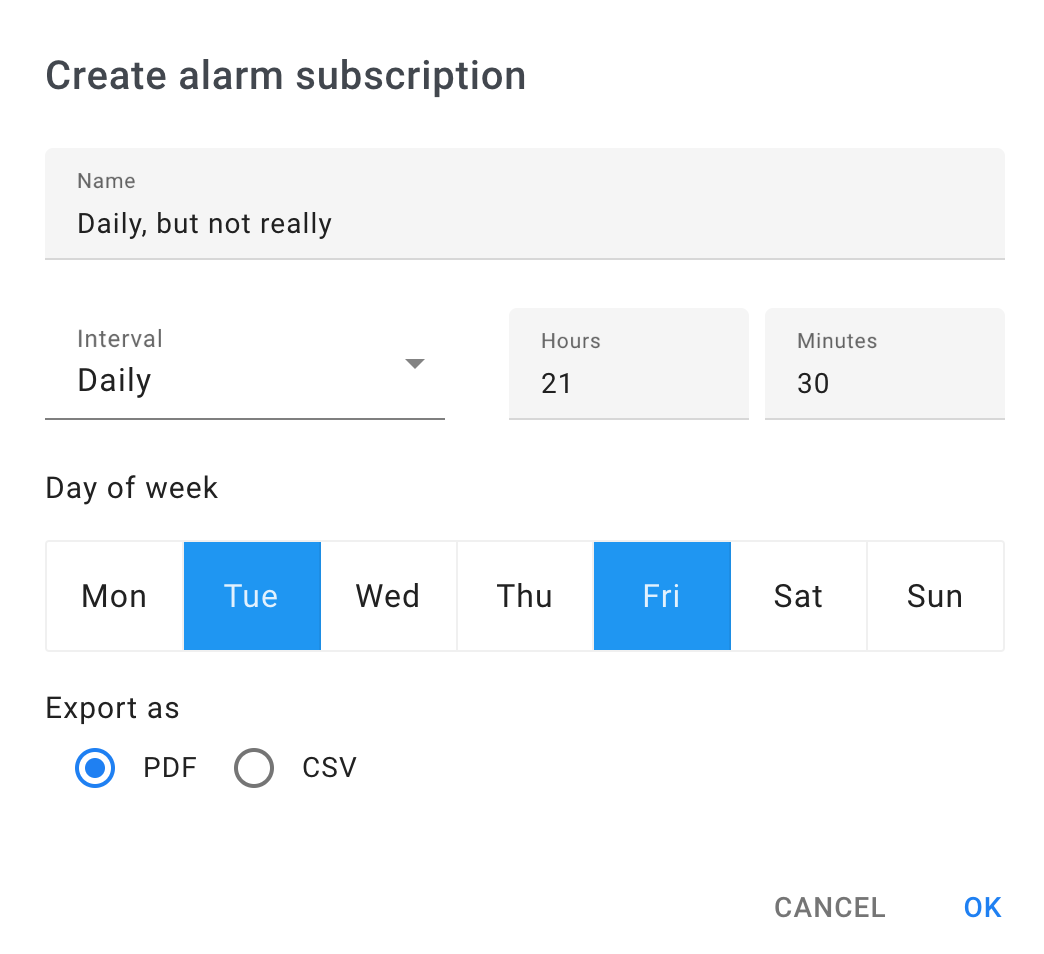
With this subscription, the user will receive reports:
- every Tuesday at 21:30, with statistics on alarms between Monday 21:30 and Tuesday 21:29; AND
- every Friday at 21:30, with statistics on alarms between Thursday 21:30 and Friday 21:29
as PDF attachments.
Compare
Shows data from two periods of the selected length in split view:
- right-side pane shows data covering a timespan of the selected length that immediately precedes the current time;
- left-side pane shows data covering an equally long timespan that immediately precedes the right-side period.
Thus, setting the timespan to 1M at 13:40, April 27 will show data from two periods:
- to the left: from 13:40, February 27 to 13:40, March 27;
- to the right: from 13:40, March 27 to 13:40, April 27
of the same year.
Unrestrained datetime selection is not available in this tab.
Widgets in this tab share data models with those under Statistics beside having split view and auto-set timespans. Models match widget-to-widget as follows:
Alarms per project
Behaves identically to Alarms by priority.
Top
Behaves identically to Alarms by the activity length.
Alarming hours
Behaves identically to Alarms by priority.
Alarms
Behaves identically to Alarms by categories.
Project-eponymous alarm (
Project X) represents agent connection loss for the project. ↩