Alarms
This interface partially overlaps with Portal » Alarms.
An alarm is a tag-bound, conditionally triggered signal that is normally configured to indicate a critical situation that cannot be automatically resolved. HMI has tools to view and analyze current and retrospective alarm data as well as to address active alarms. For general management of alarms, see Portal » Alarms; for alarm creation and/or editing, see Alarm Editor.
HMI has two status indicators to warn about an active alarm; they are visible in any section of the interface:

|
Flashing red alarm count in the Header |
| |
Bouncing red badge with alarm count in the Navigation |
The left pane lists all user-accessible alarms in their respective directories as arranged under Portal » Projects » General » Alarms. Searchbar atop provides limited search functionality.
The section has two views: Real time (opens by default) and Statistics. Most interactions with alarms are done in the former while the latter is reserved for retrospective analysis. Ribbon below the searchbar shows the active view and allows switching to the other one:
Real time
Lists current alarms in a table with batch actions and optional filtering by state.
Generates a printable snapshot of the table. Color-coded dots for alarm states are preserved but state-associated background colors for table rows are not.
Statistics
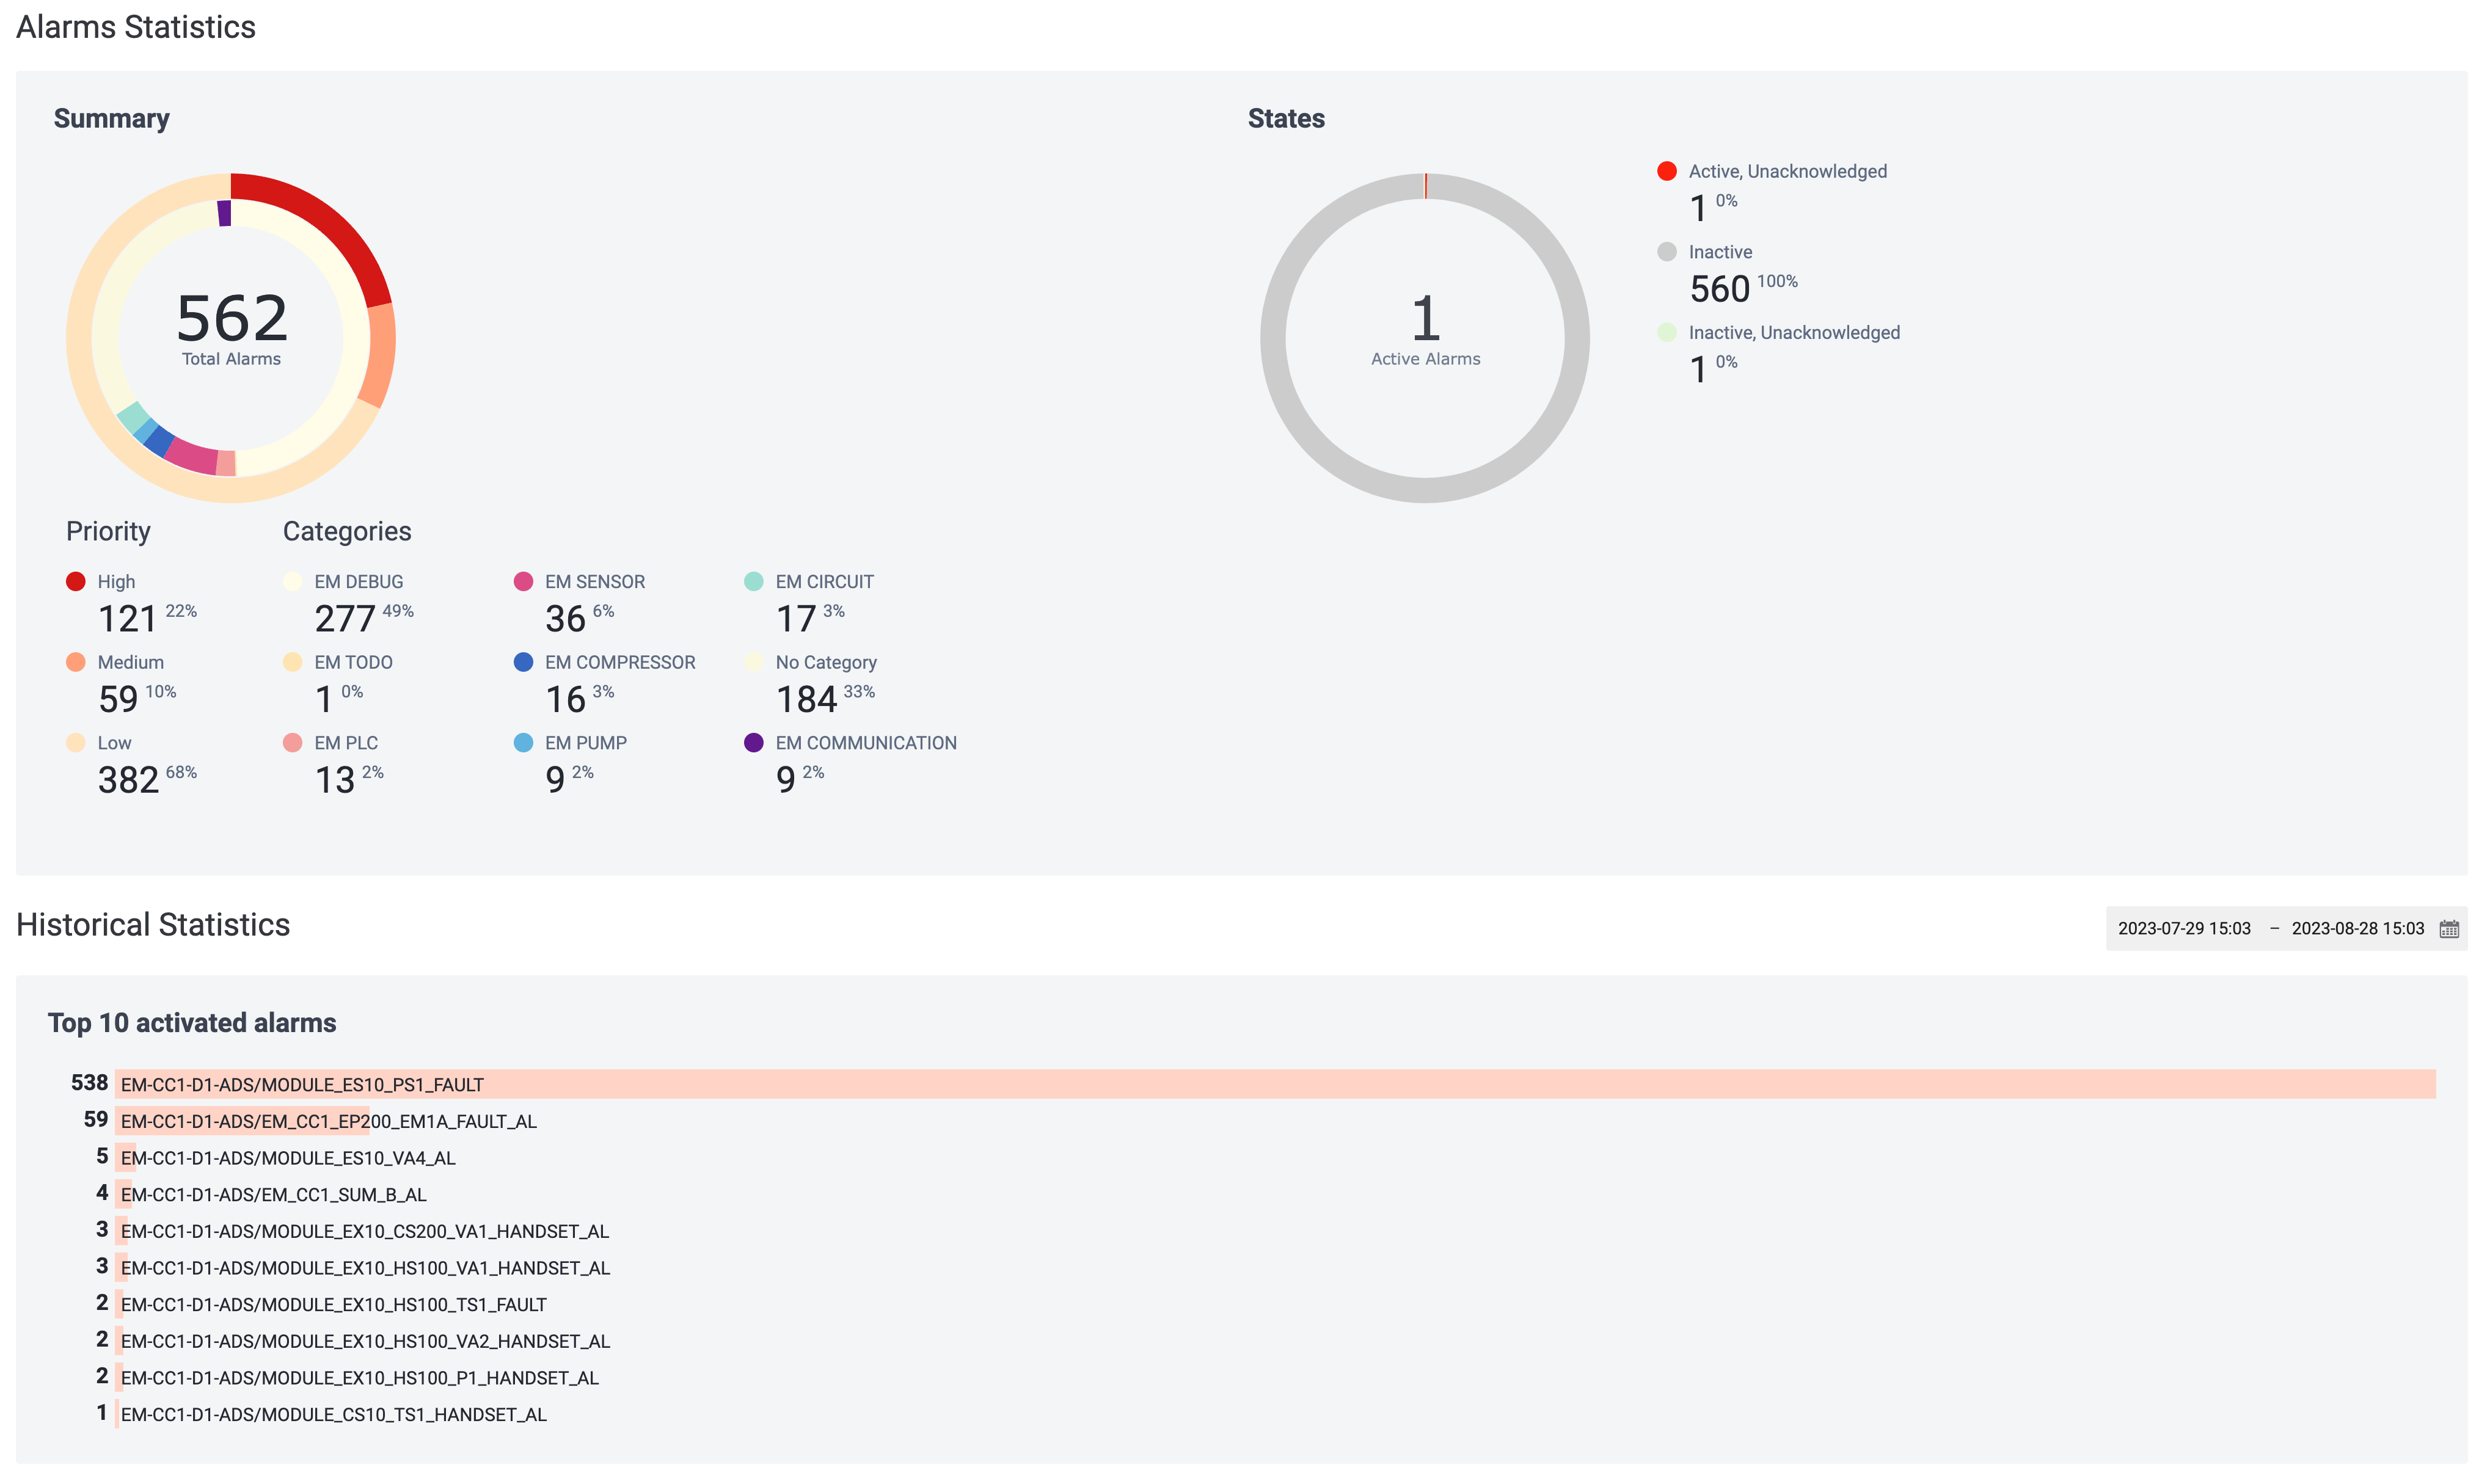
This view consists of three panes:
-
All-time alarm statistics with distributions by priority and category shown as actual values, percentages (rounded to the nearest integer), and pie charts. Color codes are preset for priority levels but are randomly drawn for categories since their only purpose is to help identify pie chart slices.The system can choose from up to 8 assignable colors; therefore, colors might duplicate if there are more than 8 categories.
Current distribution of alarms by state shown as actual values, percentages (rounded to the nearest integer), and pie charts.-
10 most commonly activated alarms over the selected timespan. For each alarm on the list, shows total count; the peach-colored bar reflects the count ratio to the most common alarm.Click on an alarm to open its activation history over the same timespan; alternatively, an alarm can be selected from the list in the left pane.
By default, the selected timespan is set to cover 30 days up to the current moment Current moment
Datetime value frozen at opening any view where a time or timespan can be set. Read further . Click on the datetime picker to change the timespan; note that either point only be picked at 30-minute intervals but more precise values can be entered manually. If no occurrences were registered during the selected timespan, an appropriate message will appear:No data available
Click to return to the general statistics.