Work With Pages
This is an introductory guide; for a complete manual on this interface, see HMI » Pages.
When working with a project in HMI, your starting point is a page. It might be the project’s default page or the one you’ve configured for yourself in your profile. It is an interactive canvas that you or other users of the project have made for a variety of uses, including:
- Partial or complete display of your’ project’s design and layout, hardware parameters and status indicators, etc.
- Quick access to important hardware settings in the form of tags.
- Insight into what was going on with the project in the past.
This article will guide you though all these functions and explain when and how to use them.
Quick links
This article covers some of the tools available in the HMI’s page viewer. You might also be interested in these related articles:
- Create a Page for guidelines on how to prepare a simple page.
- Pages and its daughter articles for a complete set of manuals about pages.
Links to other relevant parts of this documentation can be found throughout the article.
Navigate Pages
- Where
All pages you can access in the project are listed in the navigation beside the HMI menu. Pages are organized into folders, which can be expanded or collapsed. You can click on pages on the list to switch between them. Search is available, in case you are dealing with too many pages to locate one manually.
By default, a newly opened page is scaled to fit into the viewer. However, you can use your mousewheel to zoom in and out, and drag the page around with the left-click. This comes in handy when working on a large page that has many elements.

Alternatively, you can use the view controls in the upper right corner. and zoom in or out. , , , and move the viewport. You can also click on to center the viewport and/or reset the page to the default scale.
We’ll be using our Demo Setup, which has only one page, aptly named for what it represents:
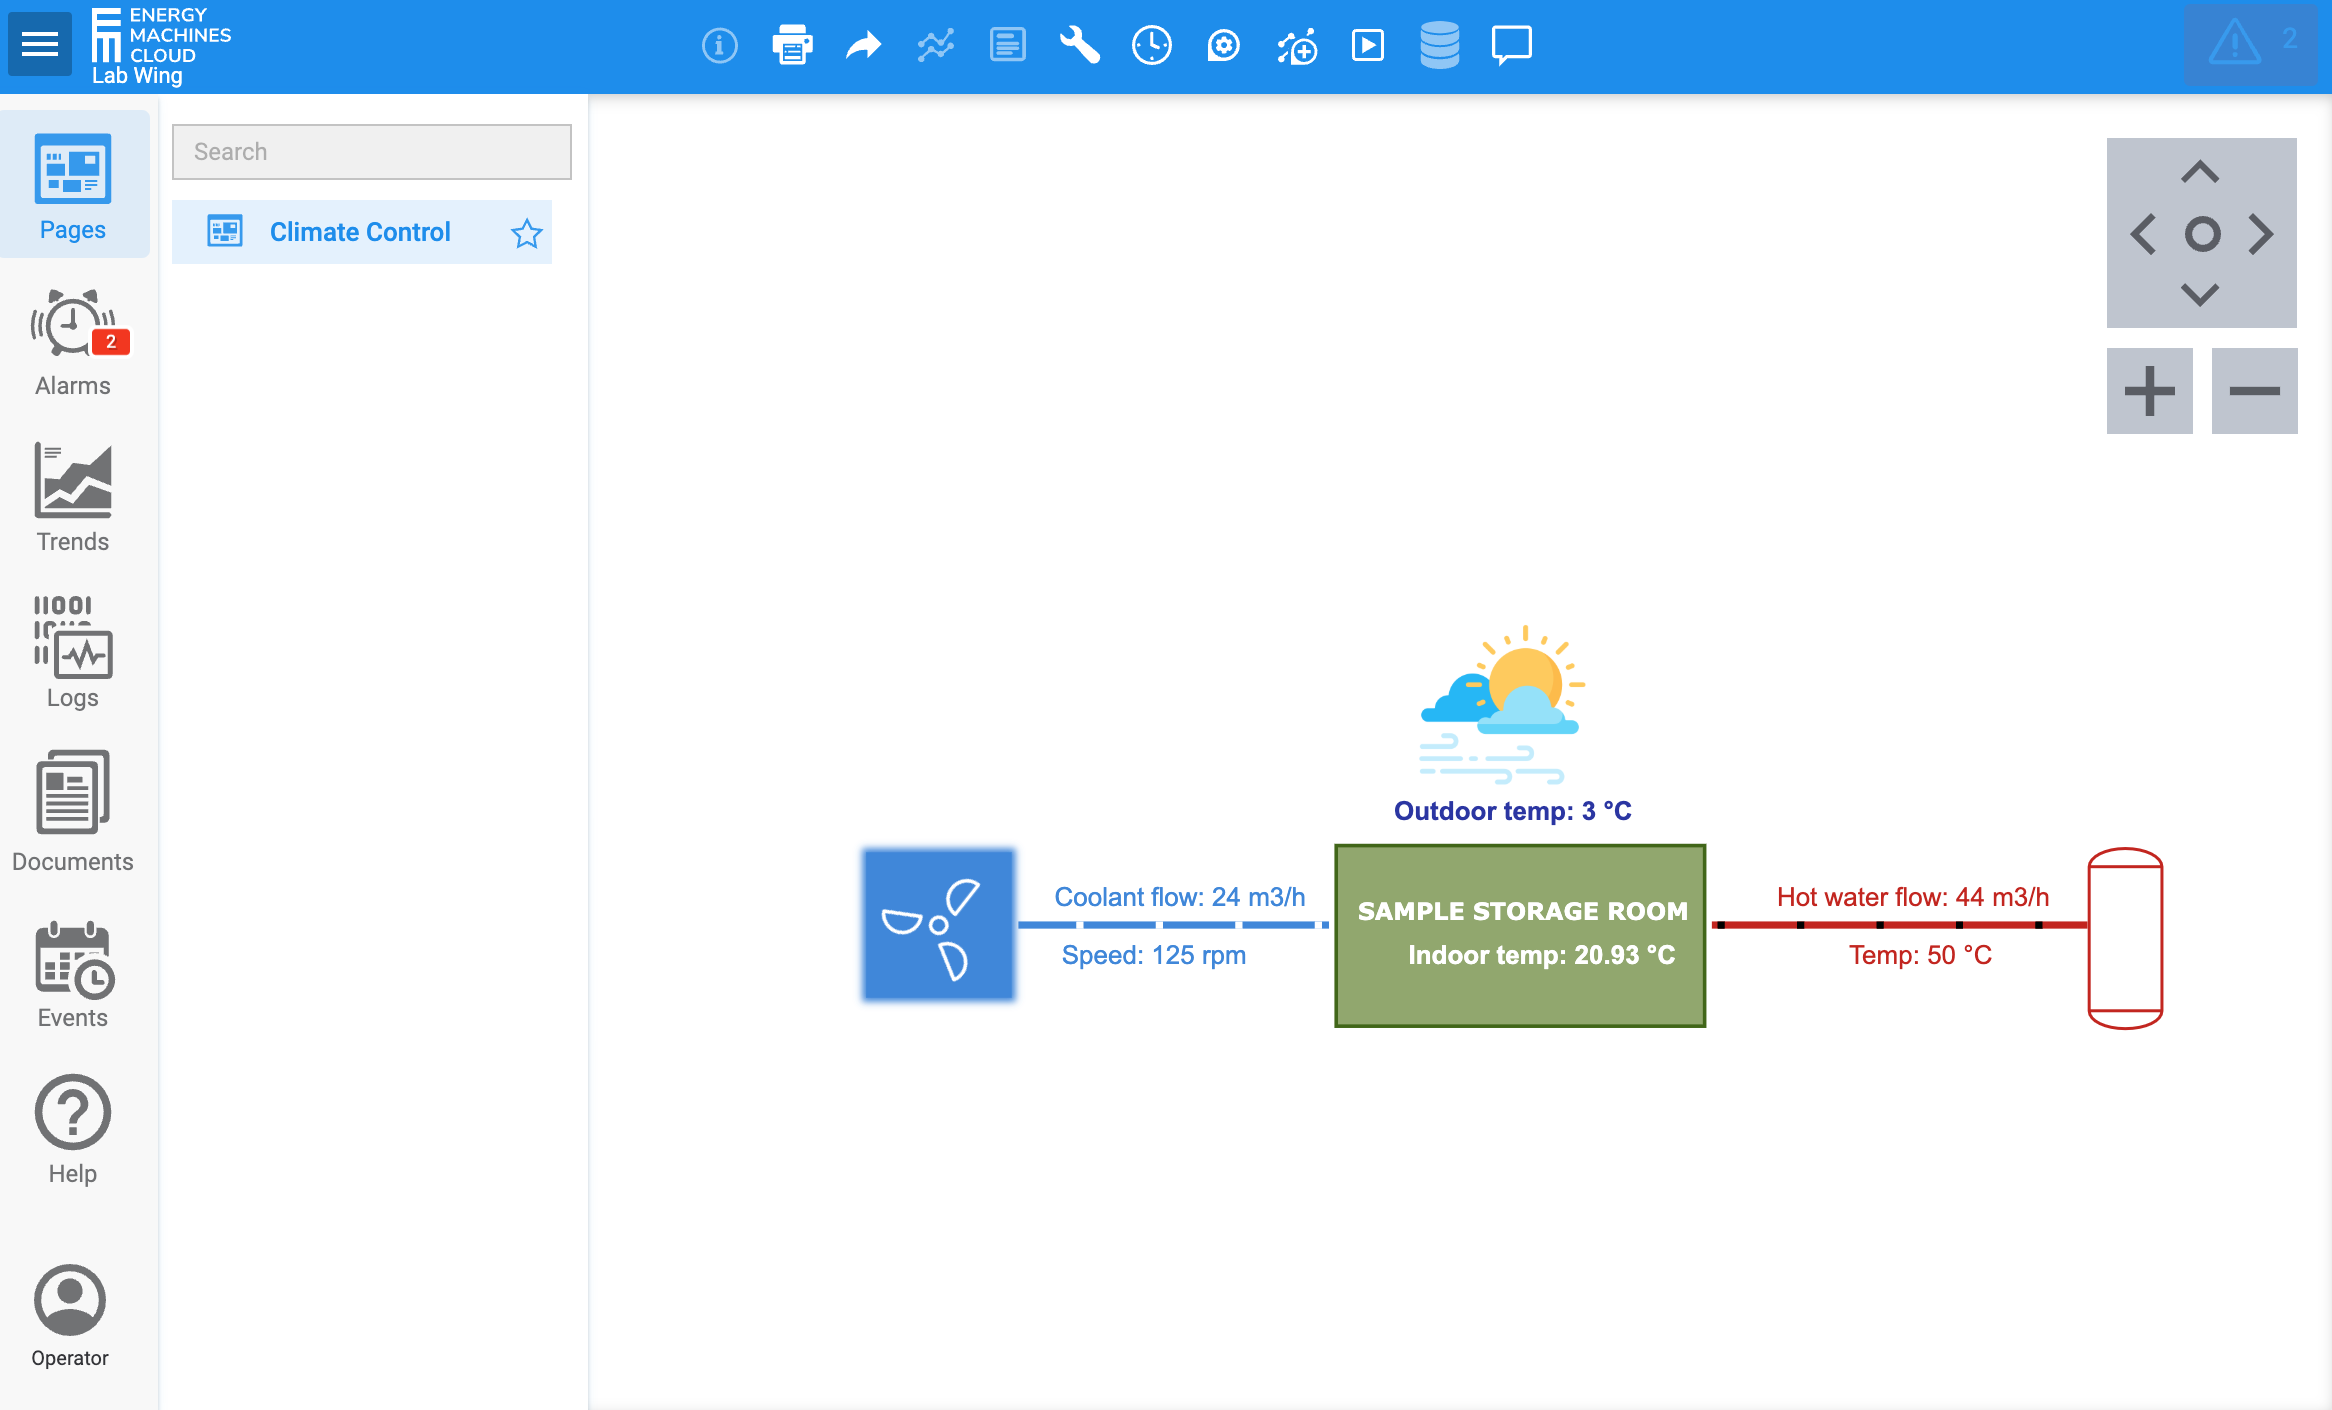
Fig. 1. This simple interface packs plethora of tools!
Write to Tags
For a variety of reasons, you might want to send values to your devices. Each individual value receivable from or by the device is represented by a tag. Tags can be configured to be writable, in which case you will be able to change their values at will.
When written successfully, the tag’s value will update and trigger further associated changes, depending on how the project is set up and configured. If the page you’re looking at shows the tag’s value, the value will update immediately.
Changing a tag’s value requires operator-level access to the HMI.
If the write attempt fails, the tag’s value will not update; instead, you’ll see an error message:
Value could not be written
This section further discusses two topics:
- dialog, which is the interface you use to write new values to tags.
- Where to find this dialog.
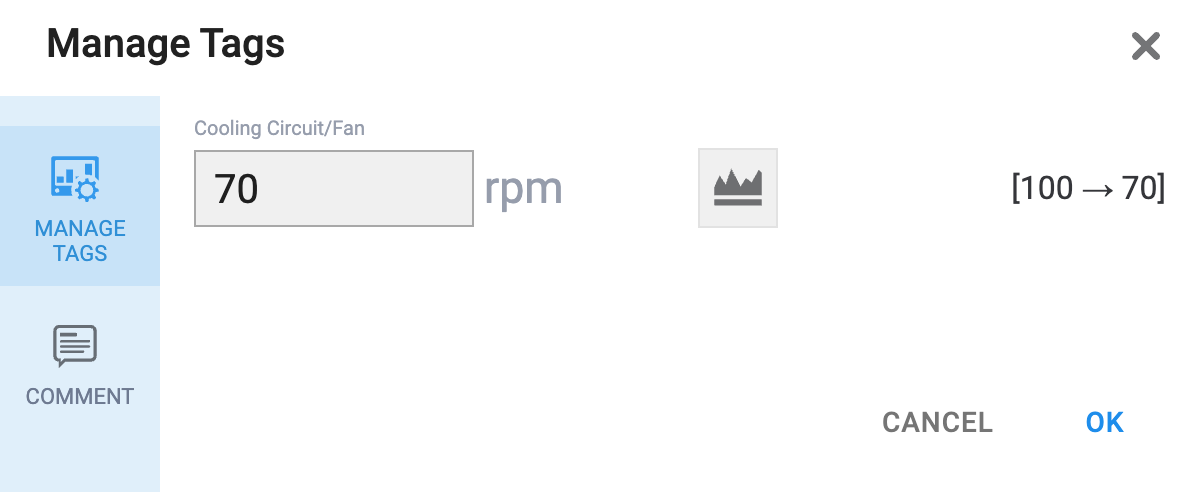
Manage Tags Dialog
is a dialog that lists one or more tags, depending on how it was invoked (see the next section). It has the following elements:
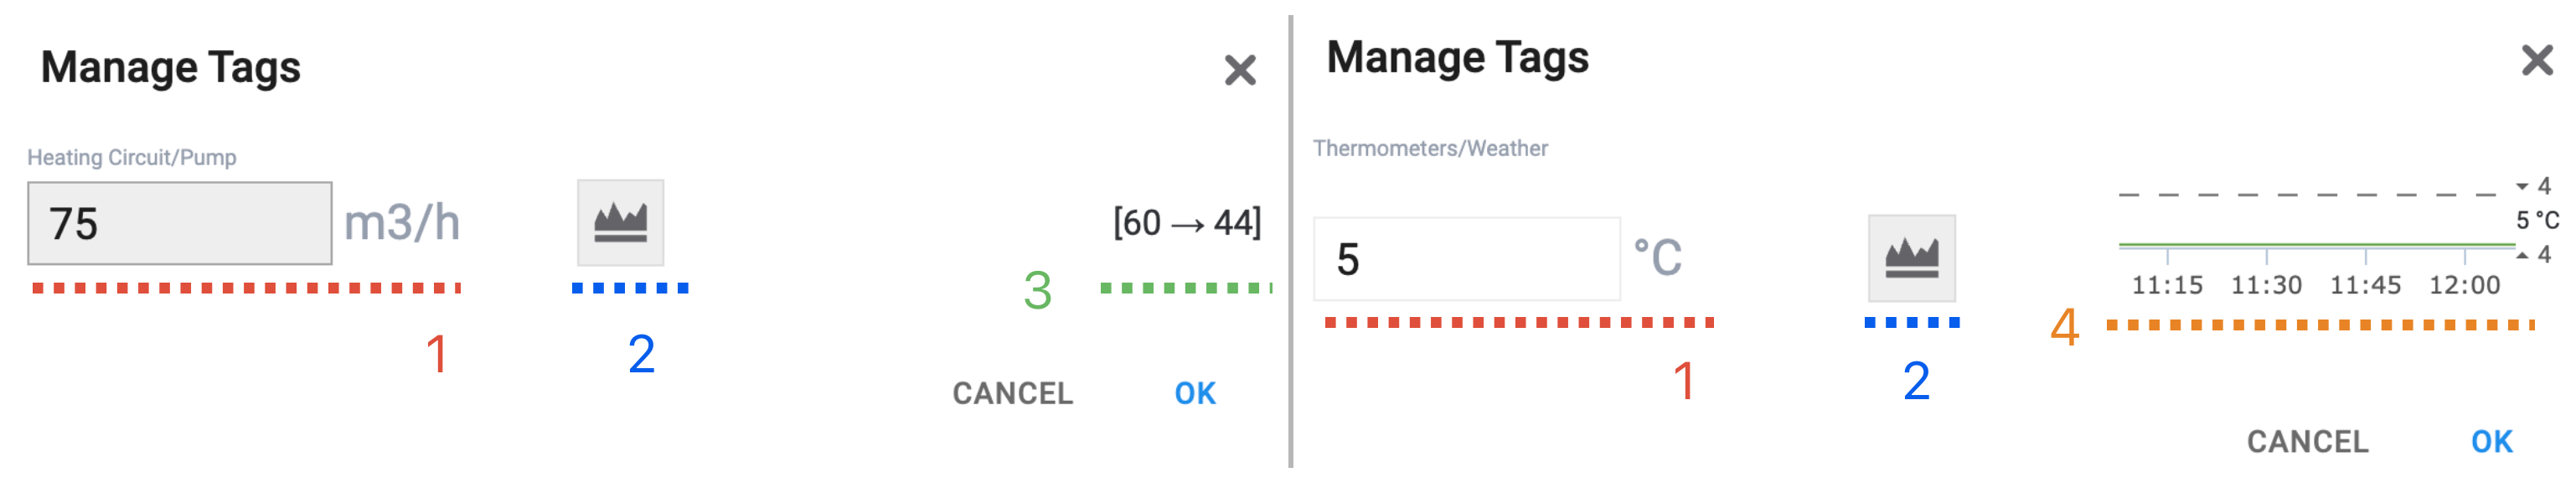
Fig. 2. Writable vs non-writable tag as seen in the dialog.
- Name of the tag and its value. If the tag is configured with a unit, th unit is also shown beside the value.
- This is a shortcut: click on this button to go to and plot a graph for this particular tag; see Analyze Trends to learn more.
- Shows the previous manually applied value change (writable tags only).
- Shows a miniature graph of the tag's value changes over the latest hour (non-writable tags only).
To write new values, simply enter them in the value fields under the tags you want to overwrite:
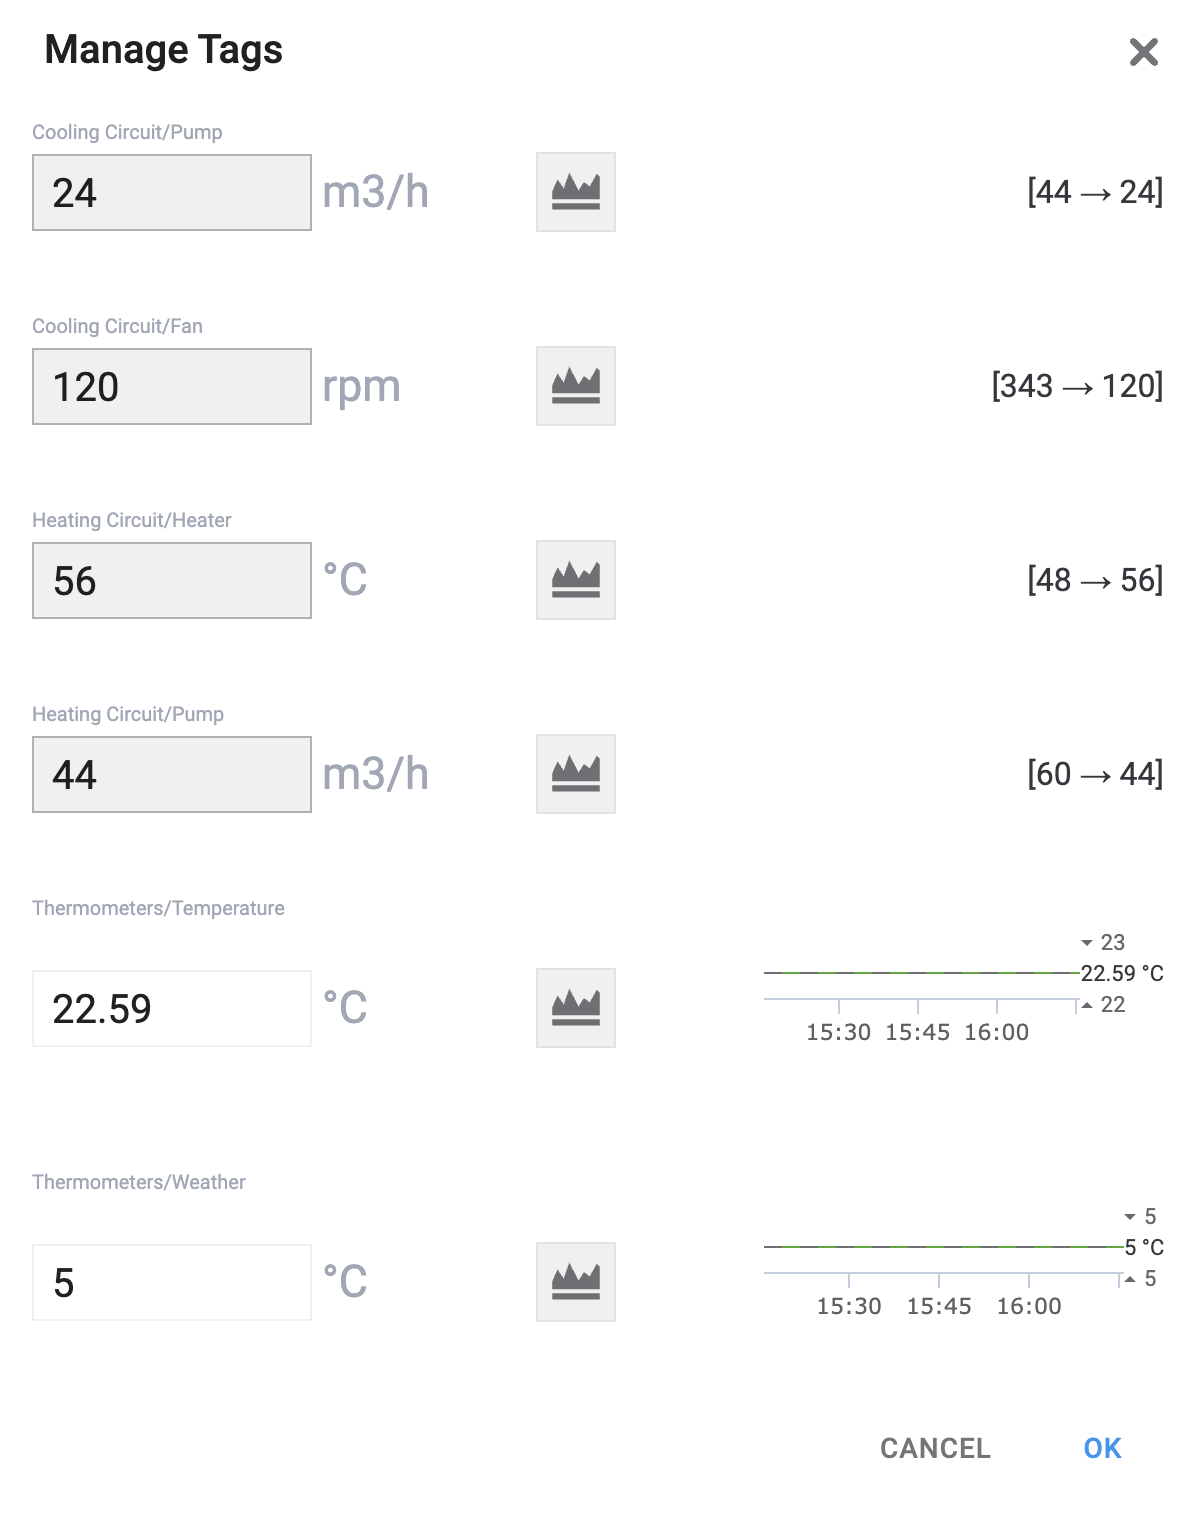 |
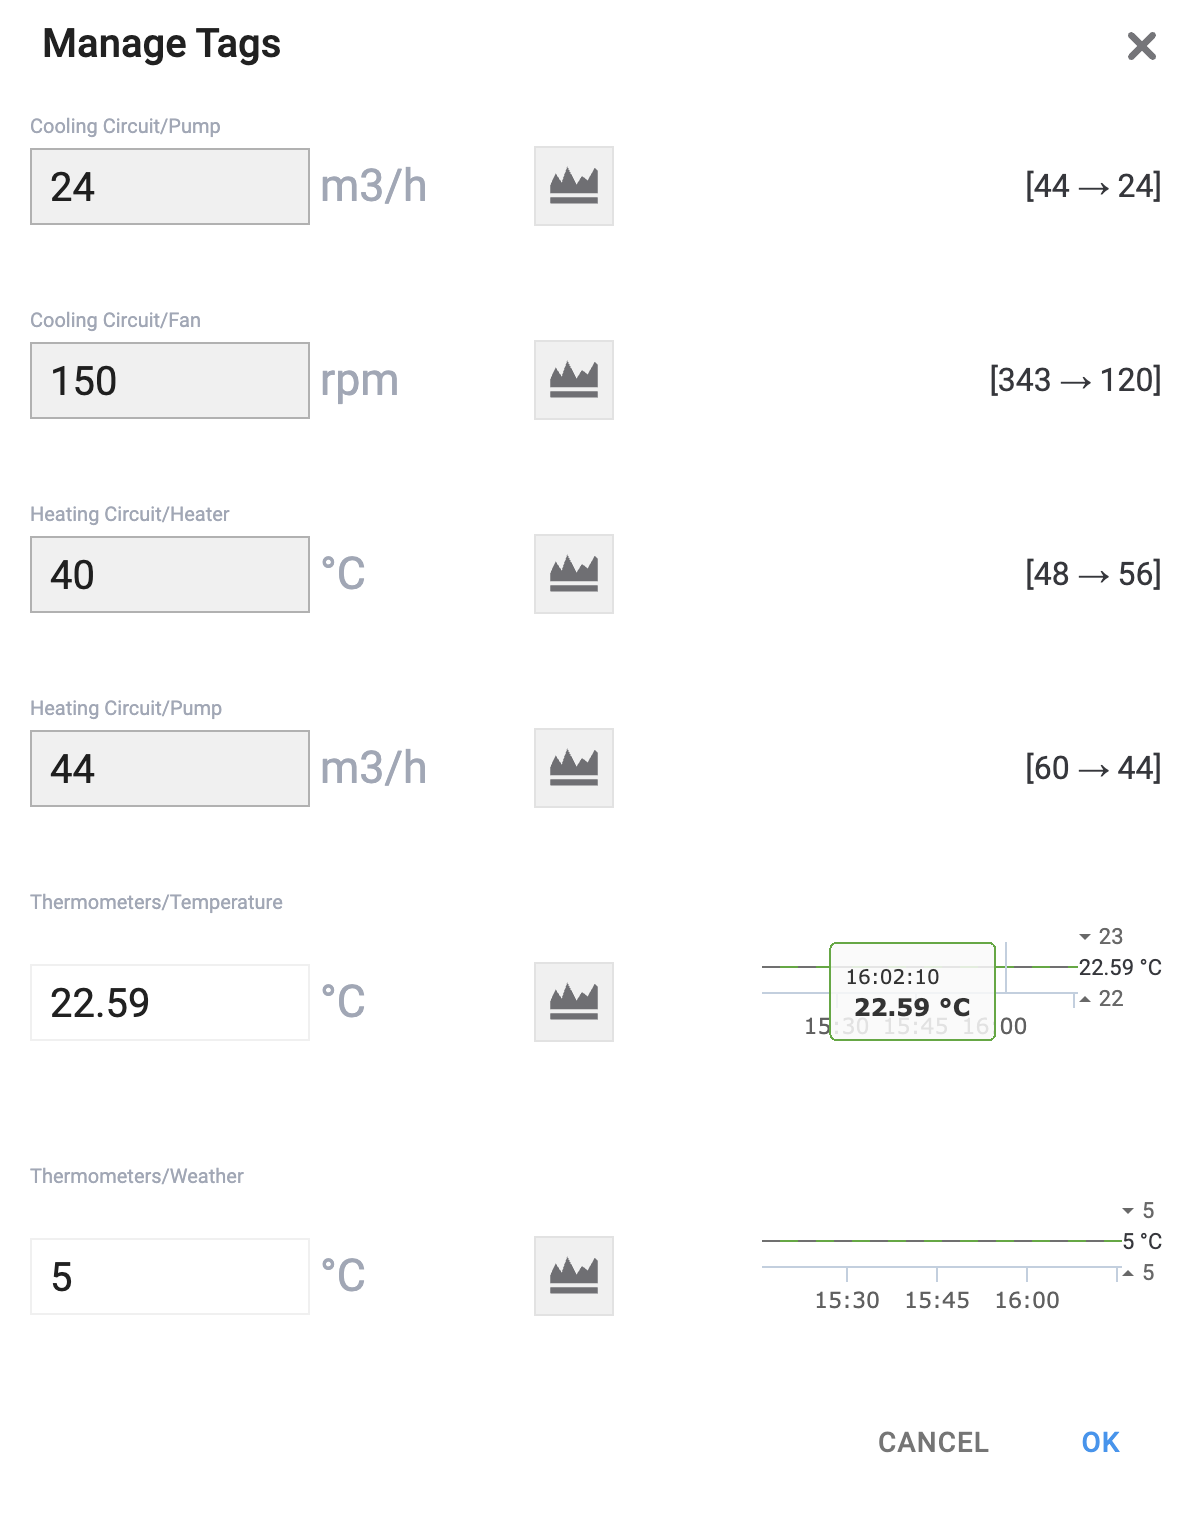 |
Fig. 3. Let's speed up the fan from 120 rpm to 150 rpm and tune the heater down from 56 ºC to 40 ºC.
This will immediately update the tags’ values and cause the corresponding changes on the page. In our case, the temperature in the sample storage room changes drastically; see Demo Setup to find out why.
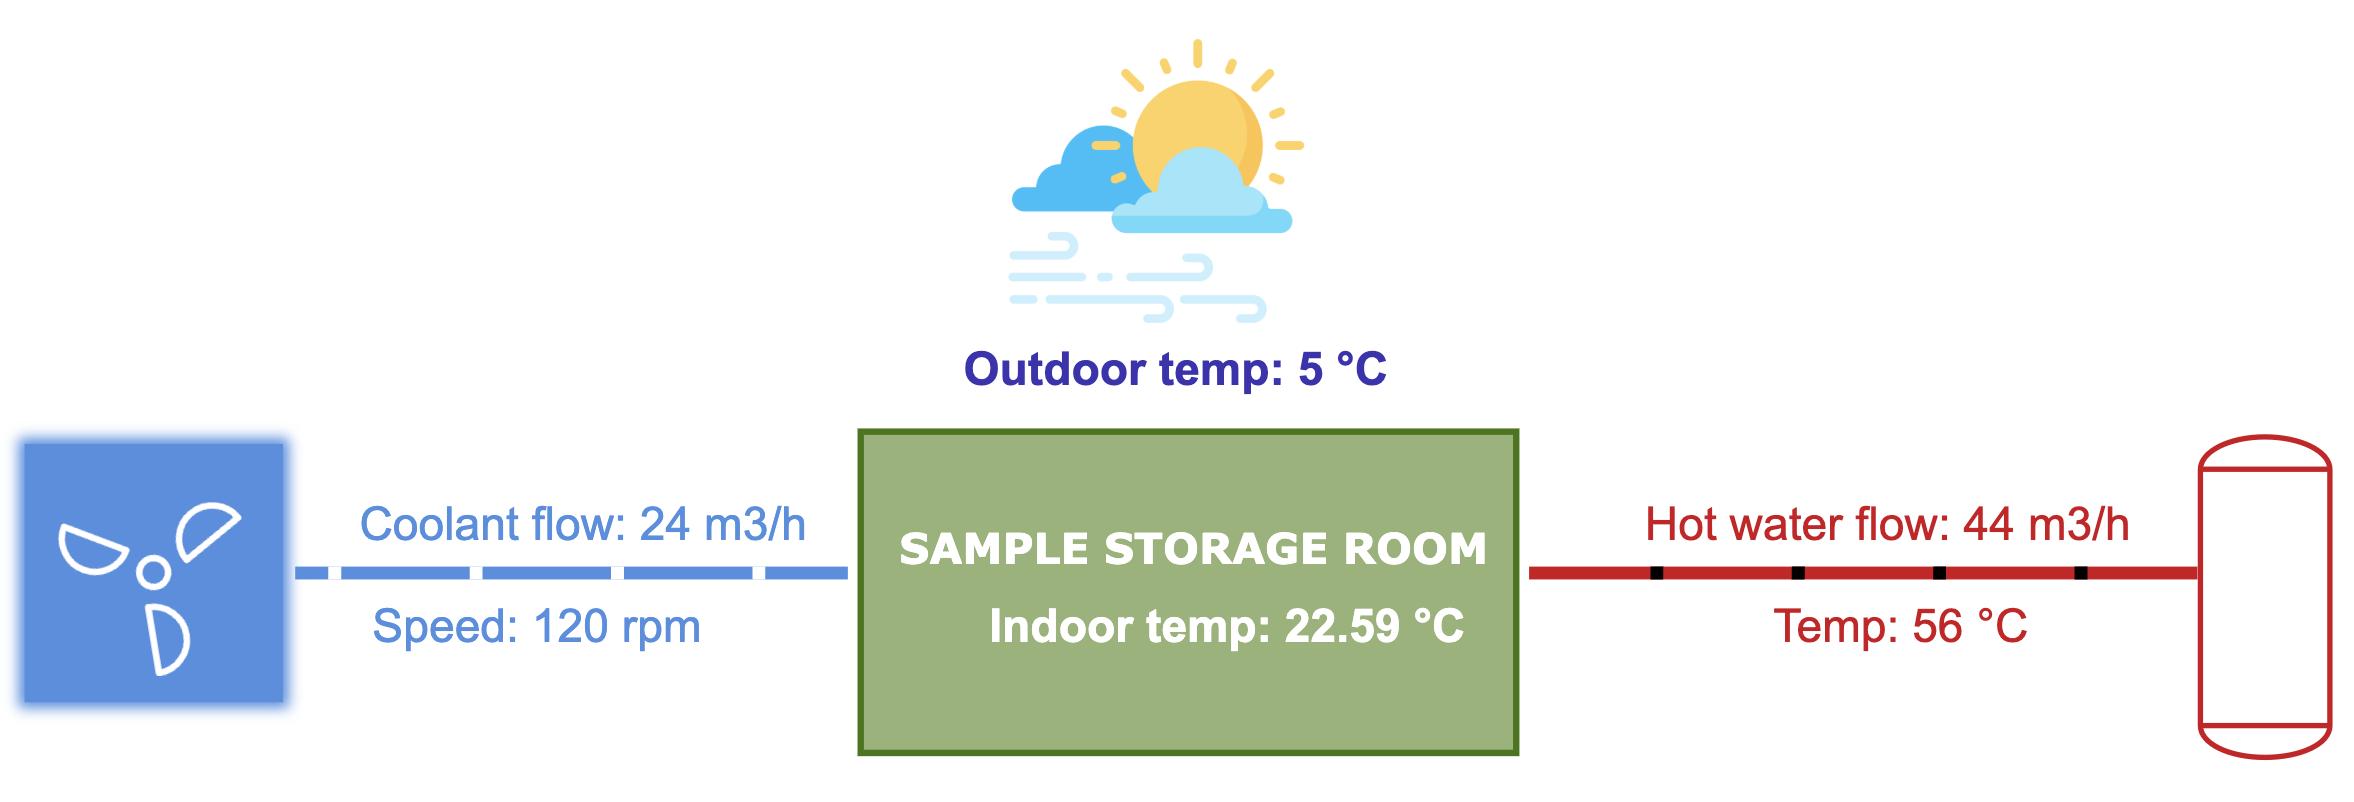

Fig. 4. Brrr! We made the lab cold!
Where to Find It
There are three ways you can access the dialog:
- You can simply click on any object on your page, whether it's a textual label showing a tag's value, or a symbol representing the hardware on your site.
- This will open the dialog with the tag(s) attached to that object with a click event.
- Fig. 2 shows two examples of a single-tag dialog opened with this method by clicking on page objects.
- Another method lists all tags added to this page as managed tags.
- Where
- » Header toolbar »

- The last method lists all tags configured for this project and provides basic search functionality, which you might want to use when working on a large-scale project.
- Where
- » Header toolbar »

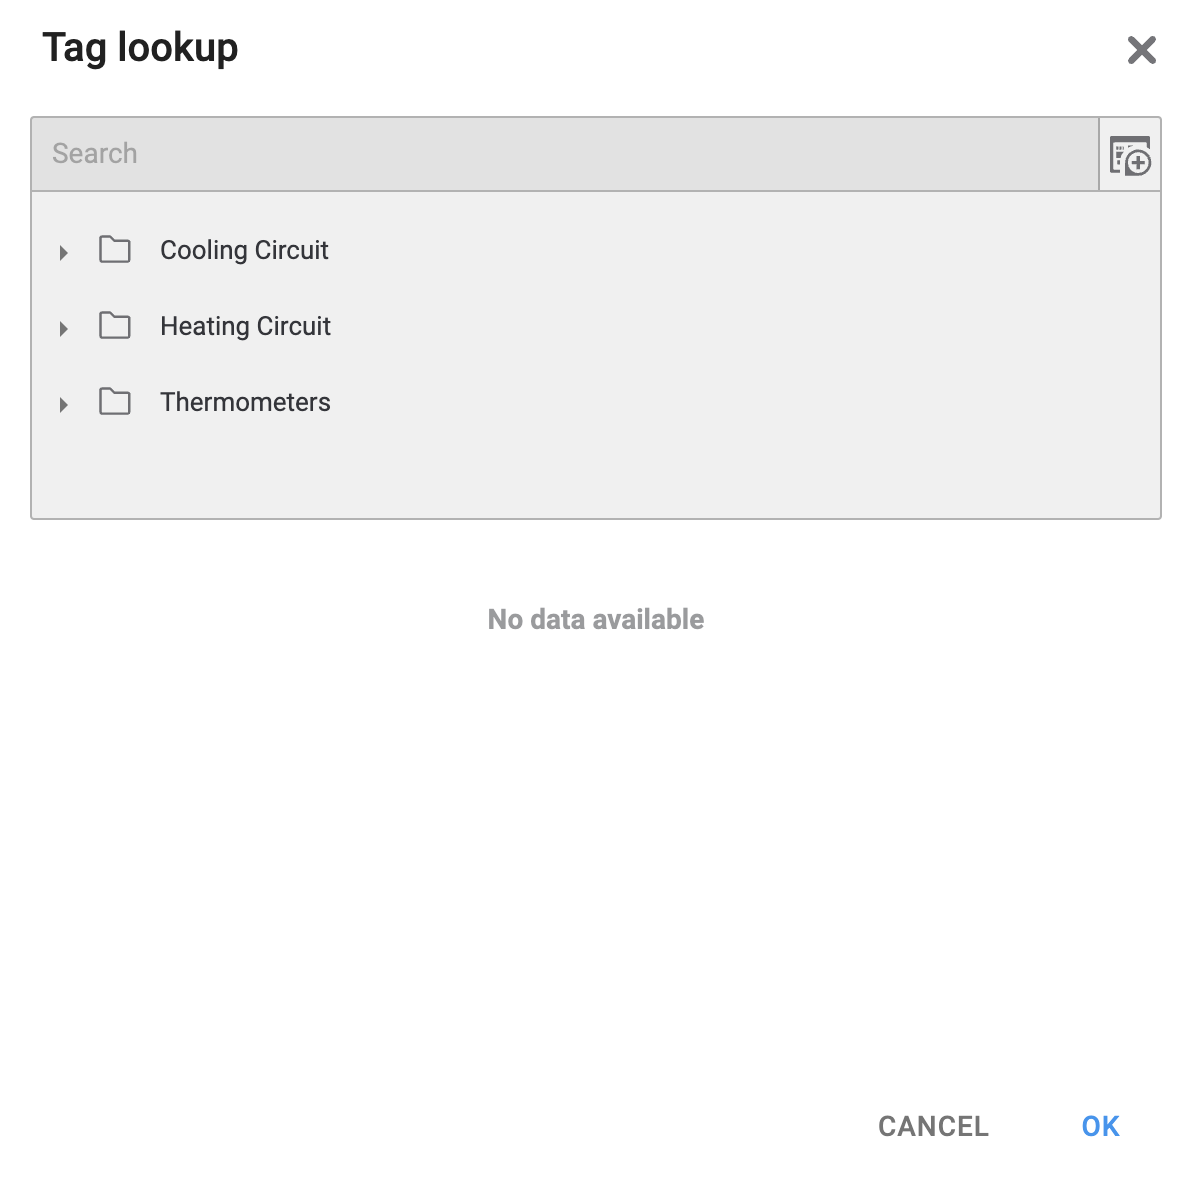
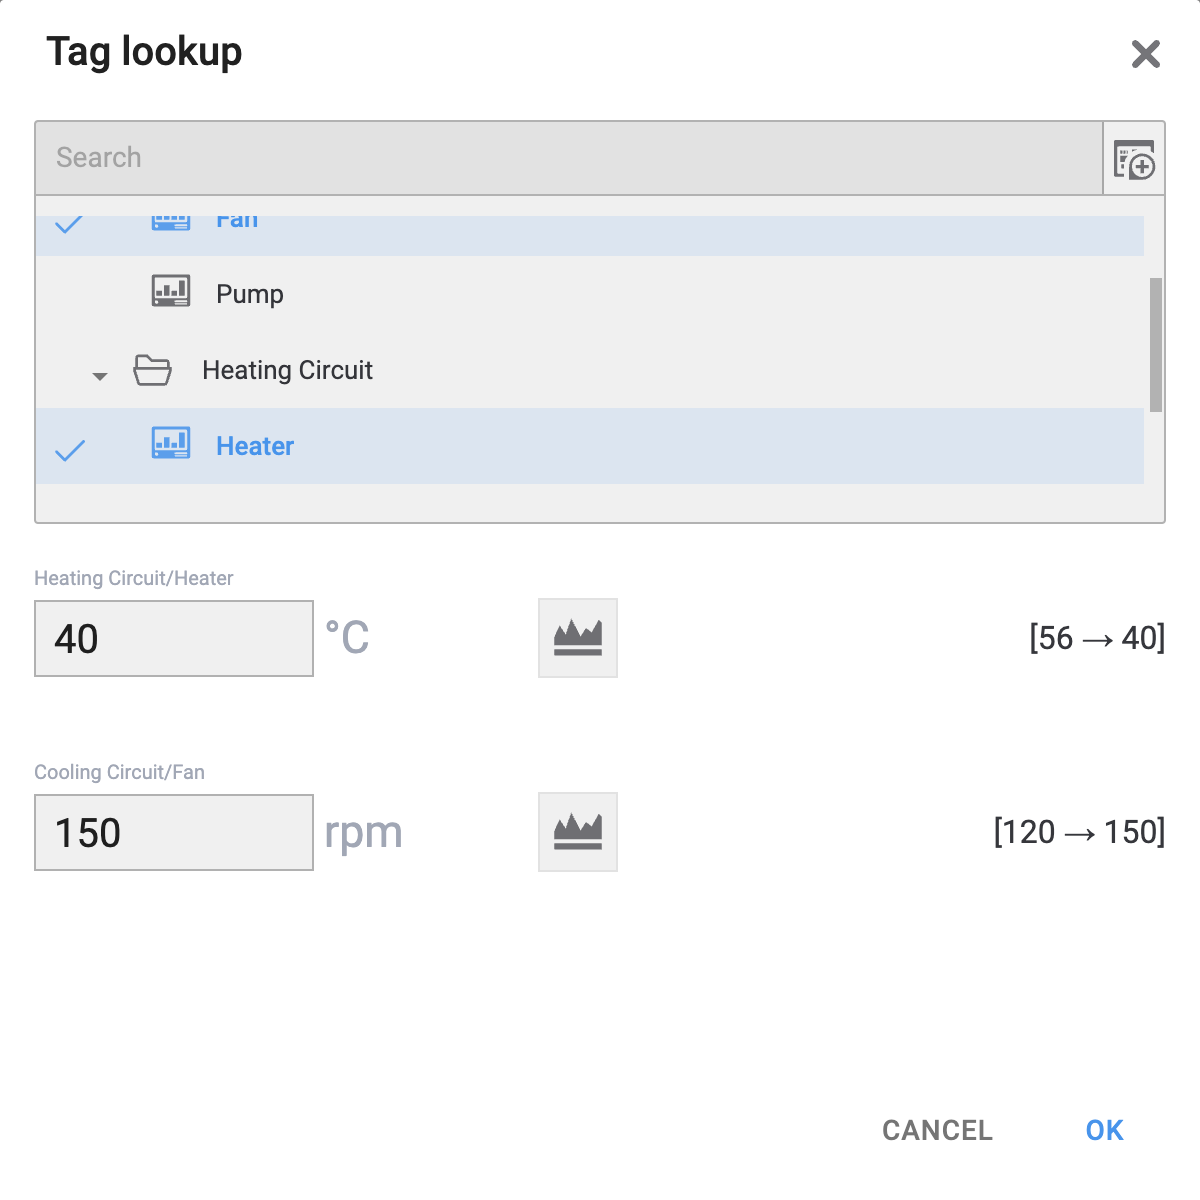
Fig. 5. Tag lookup: newly opened vs after selecting a couple of tags.
To sum it up:
- You can click on an object on the page to open the dialog for the attached tag.
- is a shortcut that immediately lists all tags attached to the page you're looking at as managed tags.
- provides the same value management tools but can access all tags in the project.
Further reading
Dropdown list is not the only way to find tags — you can also quickly add managed tags from other pages! Read about the Tag Selector to find out how.
Advanced Manual Controls
Features described in this subsection are not used in the Demo Setup and therefore not referenced elsewhere in this series of guides.
In some cases, a device represented by one of your tags may be switched to manual mode. In this case, the device’s automatic controls are disabled. The device will therefore no longer adjust its output to maintain the provided setpoint(s).

When a device goes manual, its symbol on a page will receive a yellow outline. The best practice is to configure such devices with attached tags controlling their manual mode. Those are boolean tags that have specific naming conventions:
- A tag suffixed with
_Mcontrols its associated device's manual mode; if set toON, the device is in the manual mode. - A tag suffixed with
_MCMDcontrols its associated device's operation when in manual mode. If set toON, the device is running.
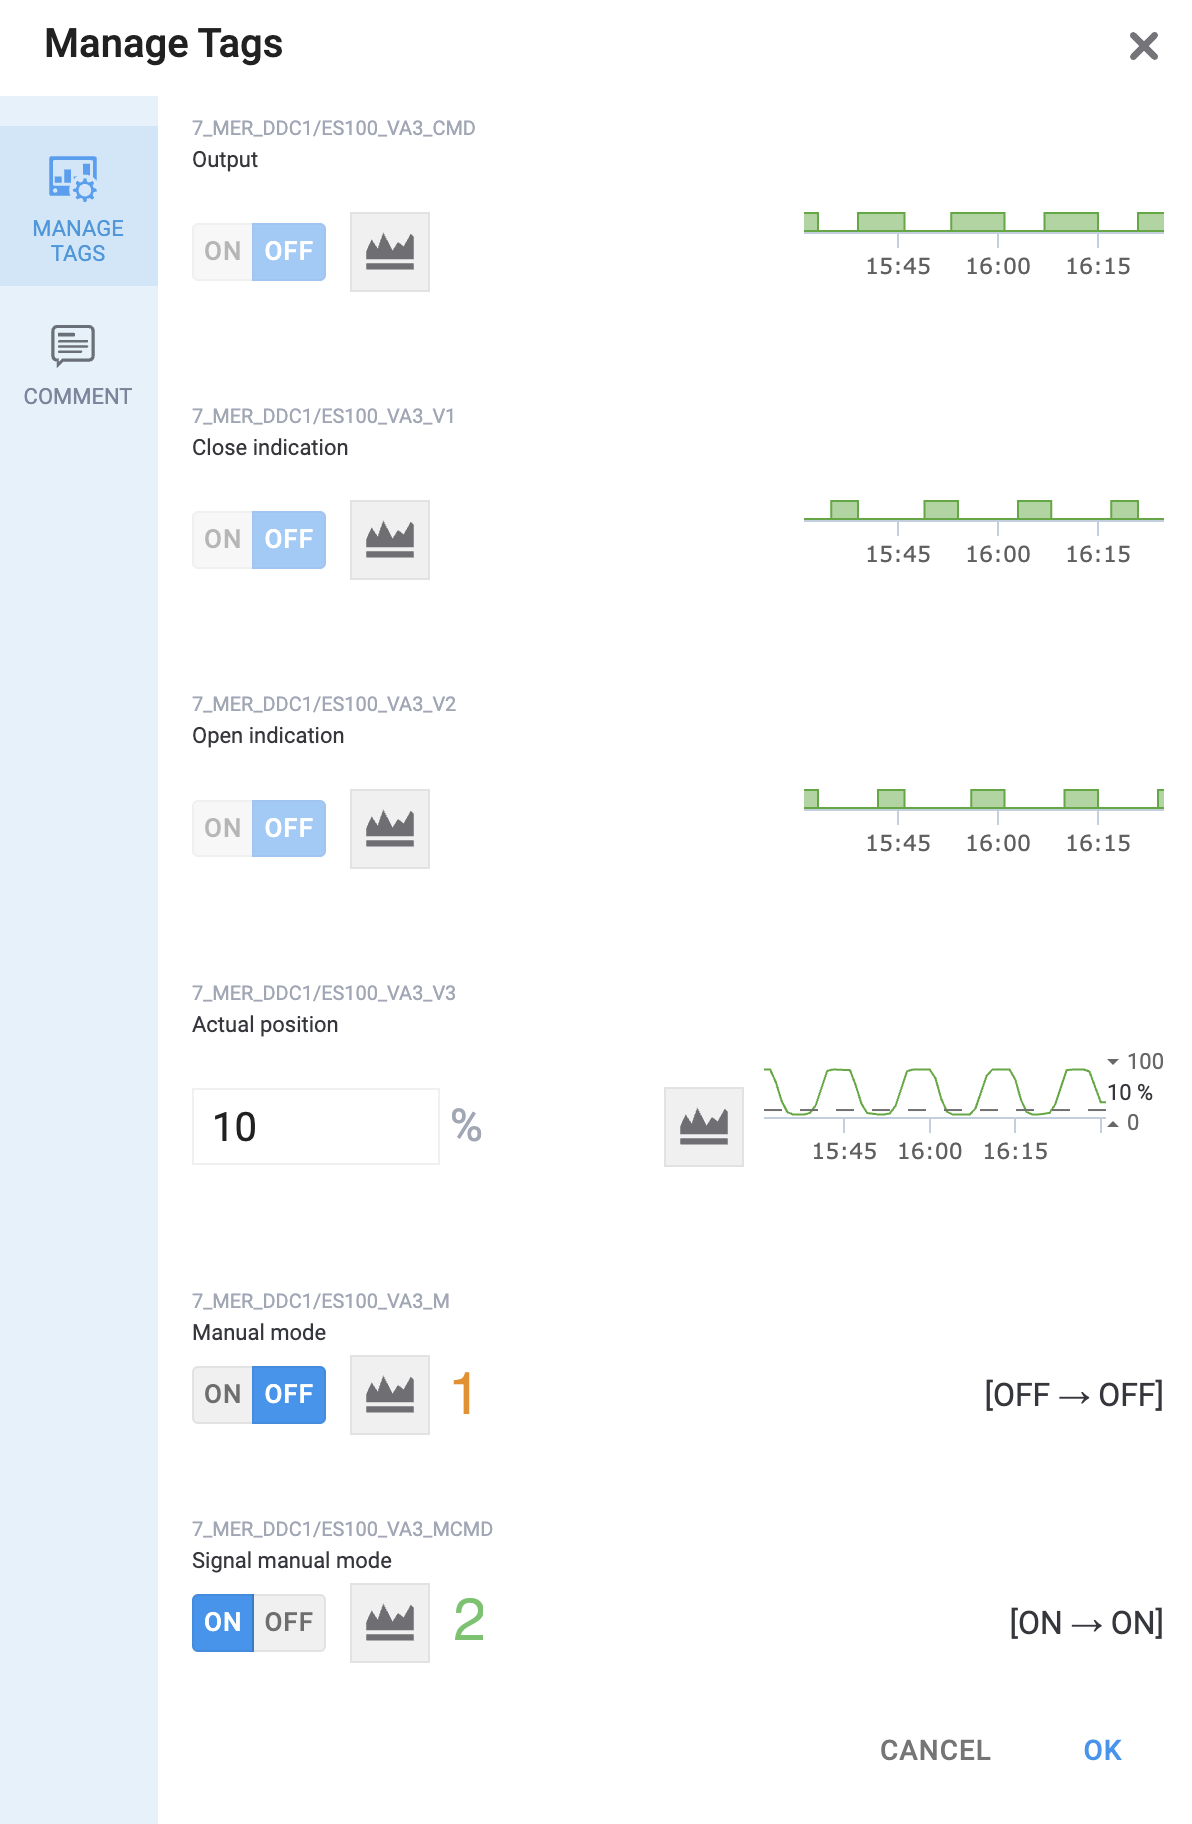
Fig. 6. Tags controlling the manual mode are highlighted.
Look Into Past
Sometimes, you might want to know what happened with the project’s hardware at some point in the past. Luckily, the page viewer in HMI has a couple of neat tricks for just that purpose!
Rewind the History
- Where
- » Header toolbar »

This tool, when activated, switches the page viewer into history playback mode, which adds playback controls at the bottom of the interface:
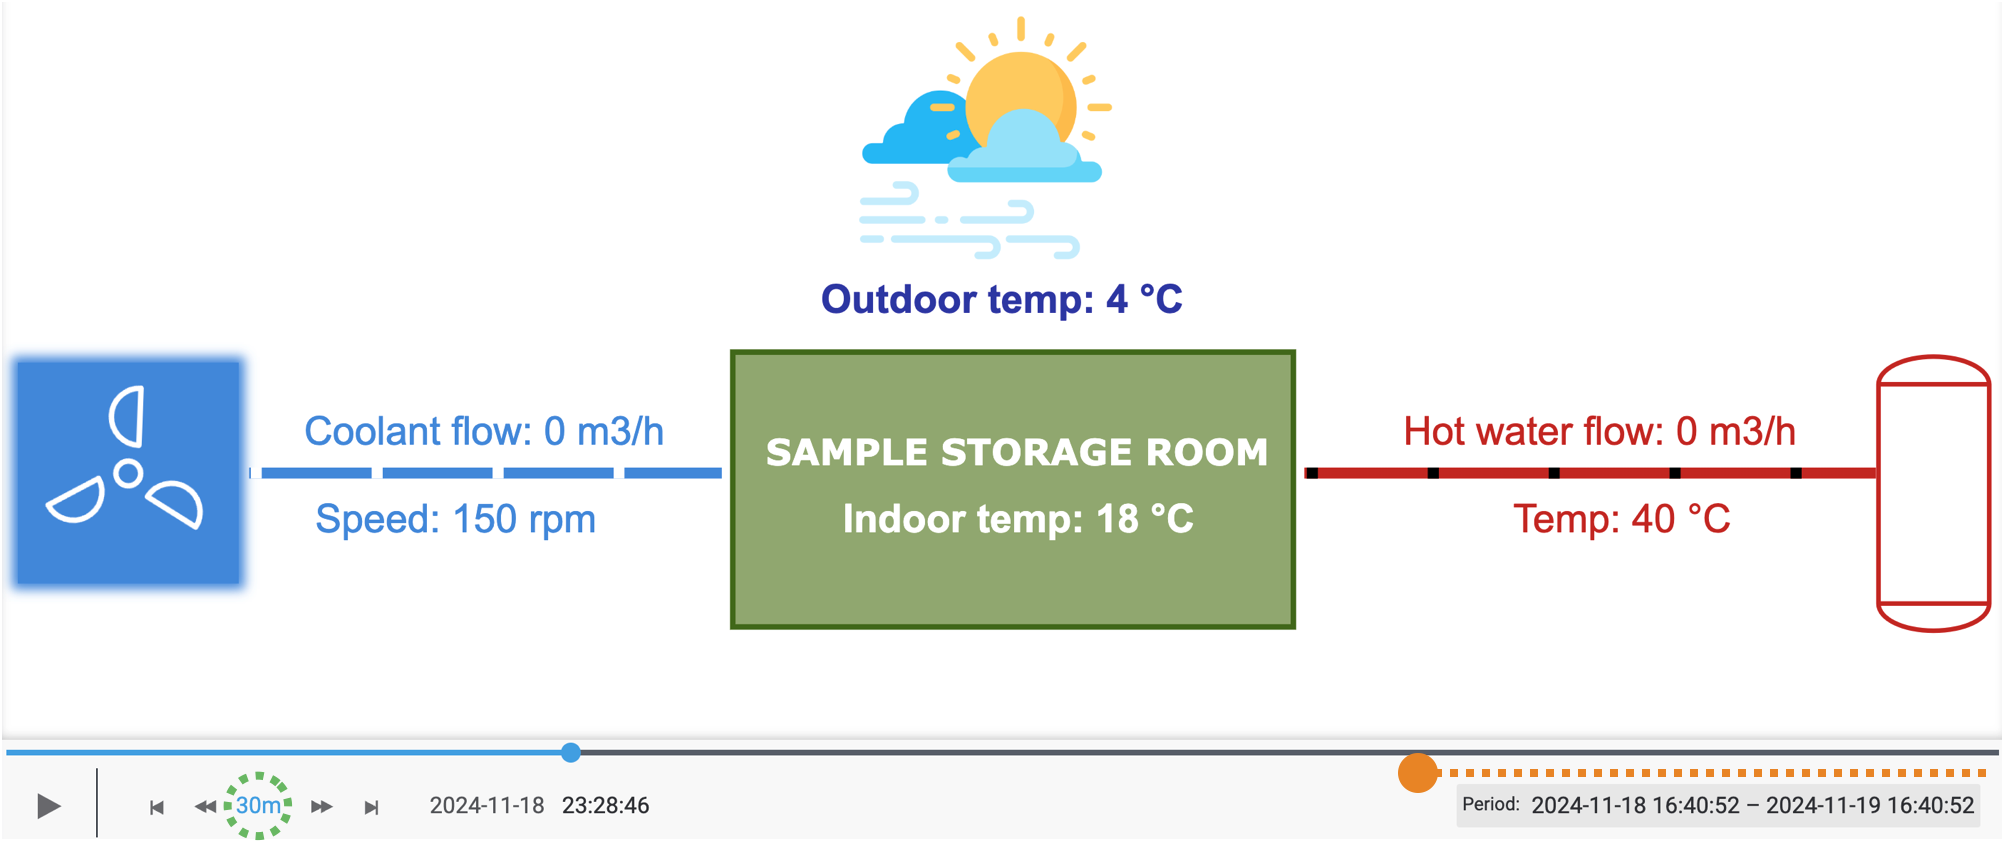
Fig. 7. A snapshot of the page as it looked some time ago.
Here, you want to configure two parameters:
-
Datetime picker; sets the replay duration as the period between two points in time. By default, the period is set to one week prior. -
Sets the speed of history playback; default is1m, corresponding to one minute.
Click on to start the playback. The following will happen:
- The selected period will be split into chunks equal to the value set as the .
- The page will begin changing, showing what it was like in each such chunk.
- Each chunk will be shown for one second; tag values on the page will be averaged over each chunk individually.
You can use other playback controls to change the speed during playback, pause and resume, and jump between chunks. You can also click on the playback bar or drag the position marker to jump to a position. The current position is shown as the datetime beside the playback controls.
After you’re finished, click on to exit the history playback mode.
Tags must be configured to have their history stored, in order for the playback to render their past values correctly. Missing values will be rendered as 0 or null, as seen in Fig. 6 above.
Make a Trend
History playback is a great tool that enables you to reproduce the state of a page at some point in the past. However, you can only see momentarily captured tag values in it. If you want to see how values changed over time without scrubbing through the playback, or compare values from multiple tags on a timeline, you need another tool:
- Where
- » Header toolbar »

When active, this tool switches the page viewer into tag pickup mode, which highlights the tags attached to the objects on the page:
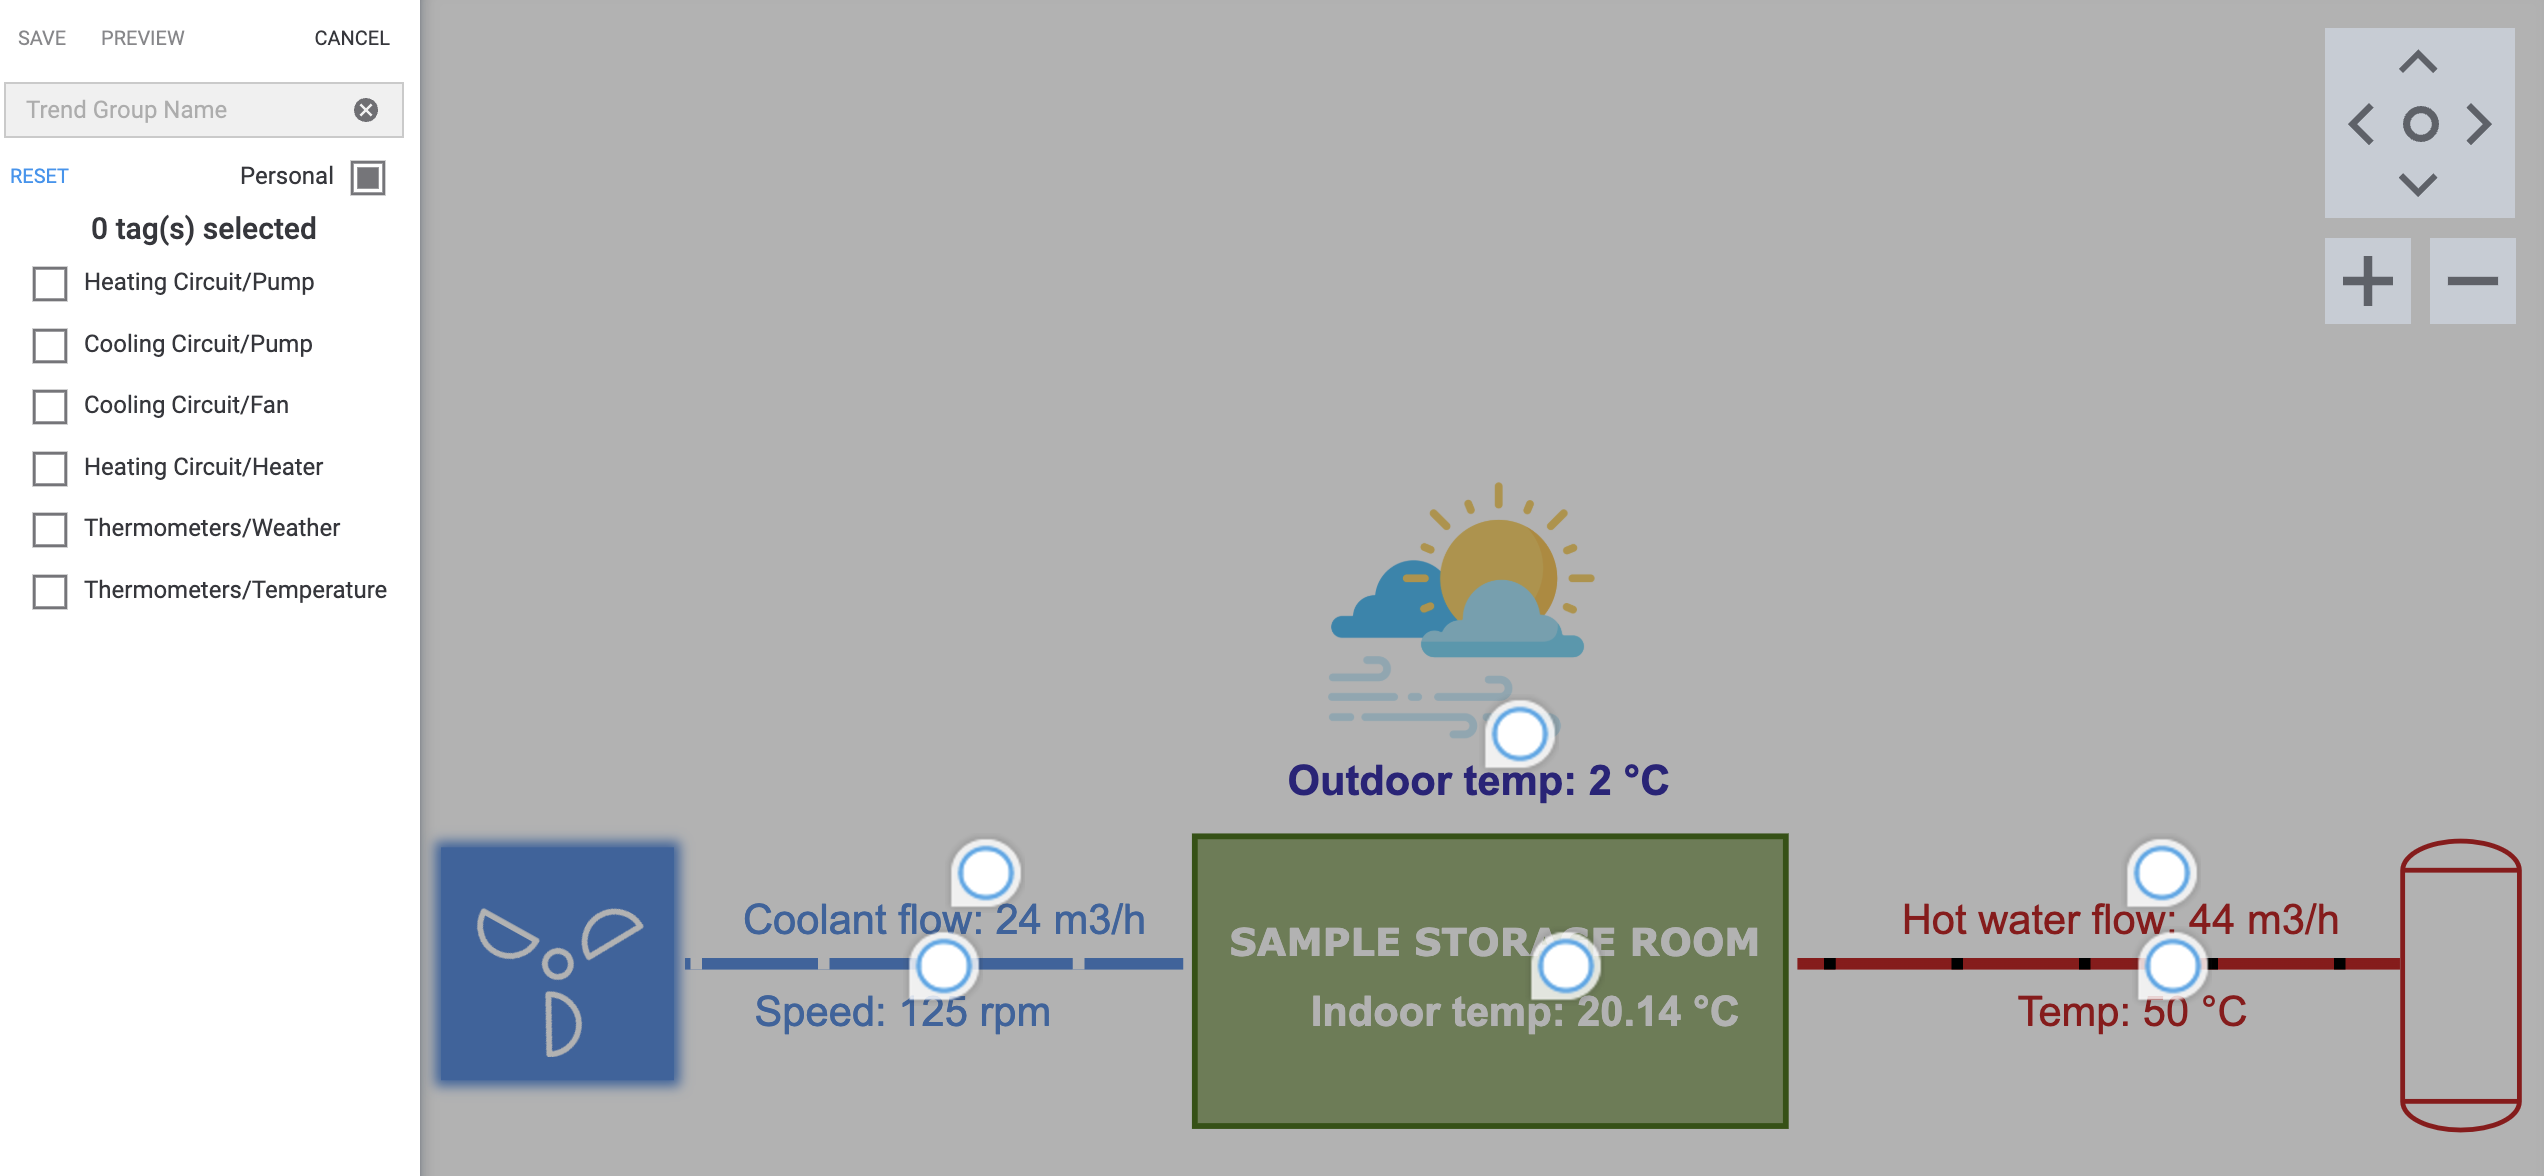
Fig. 8. These are the tags on the page.
Now you can select the tags you want to generate graphs for. You can check them on the page itself or on the list to the left. You also need to come up with a name for the newly created trend group.
Only tags linked with the parameter in the object’s Additional properties are visible in this mode.
is another important setting here. If checked, you’ll create a private trend group for only yourself to see. If unchecked, the newly created group will be public, visible to everyone on the project via . Note that public groups cannot be made private after the fact.
Once you’ve selected the tag(s) you want to generate graphs for, you can click on and see what it is going to look like. From here, you can go to change your selection or to create this new group.
The viewer then will switch to and display your trend group!
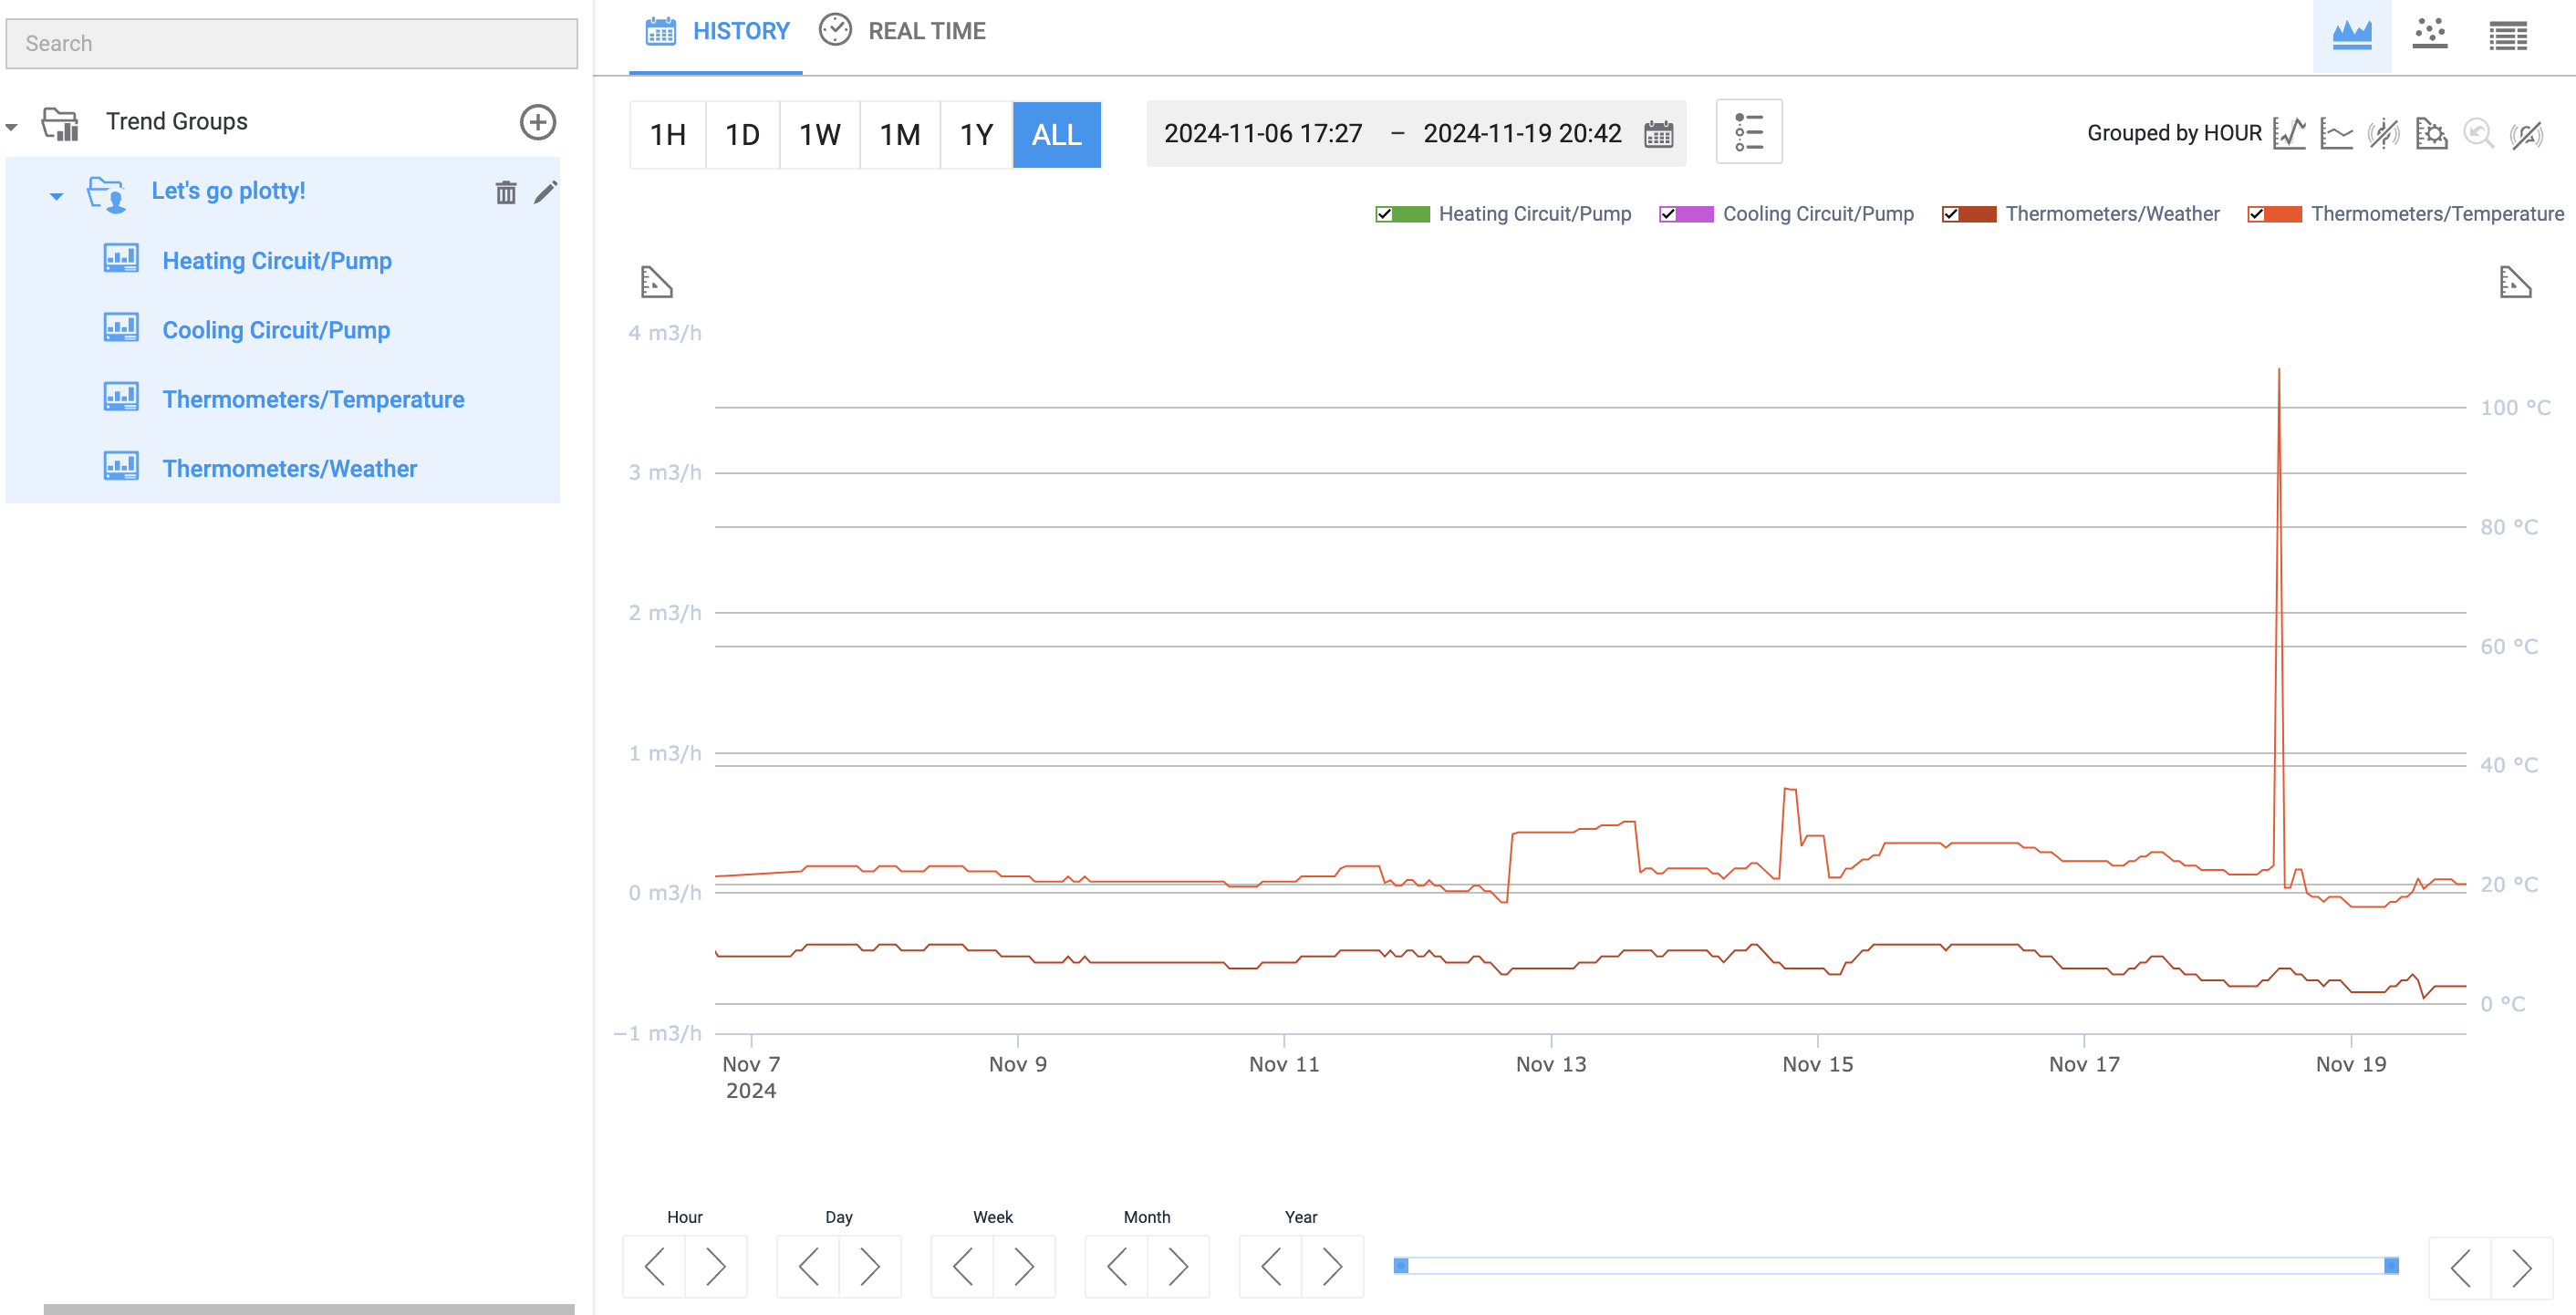
Fig. 9. Here's what a trend group might look like.
To learn other ways to create a trend group and find out how to explore them for data, see Analyze Trends.
Collaborate
Last but not least, you may want to share your thoughts, ideas, and comments with your colleagues working on the site. The Cloud’s HMI has you covered here, too. One tool that you may find useful is comments:
- Where
- » Header toolbar »

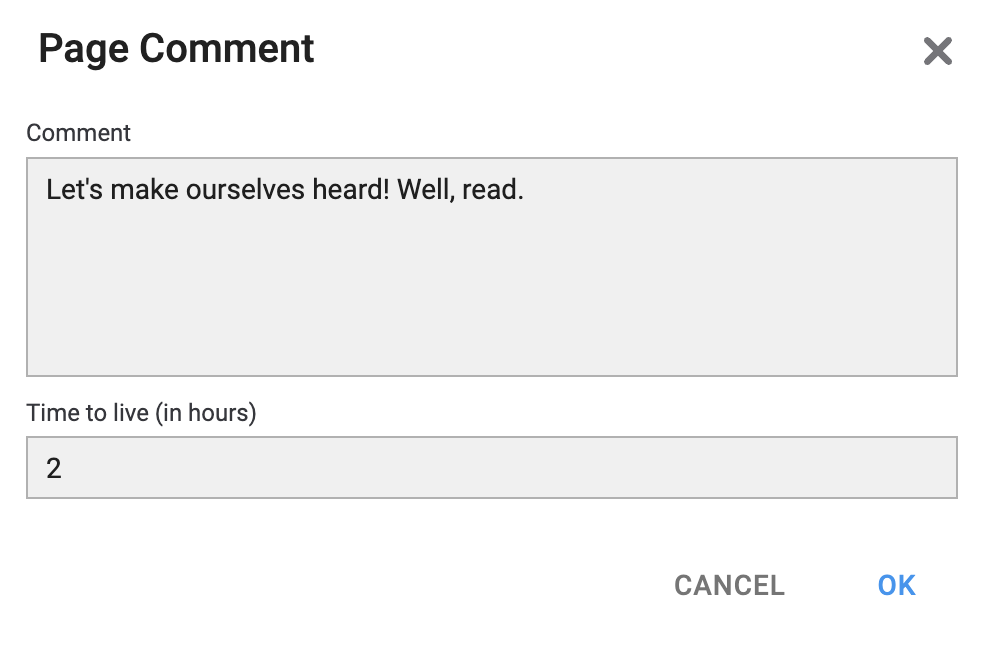
You can use this tool to add a page-wide comment, which will then be visible to other users together with your username and timestamp. Only plain text is accepted. You can also specify , after which the comment will expire and delete itself (leave empty to make the comment persist).
Once you’ve added a comment, the toolbar icon will change to , and you’ll be able to click on it and see the comment you’ve made.
 |
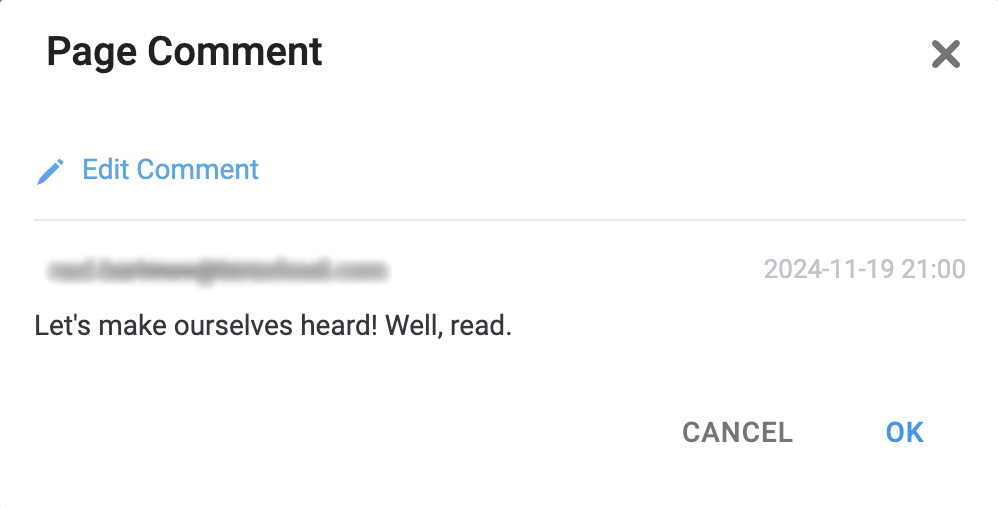 |
Fig. 10. We've just added a comment that will self-delete in two hours.
Once a comment is up, it can be edited with the option. However, it cannot be deleted until it expires.We previously discussed objects can provide quick access to tags as long as at least one tag is attached as a click event. Some object types take this further and allow you to add comments in the dialog. These comments become visible to other users who can access this page:
 |
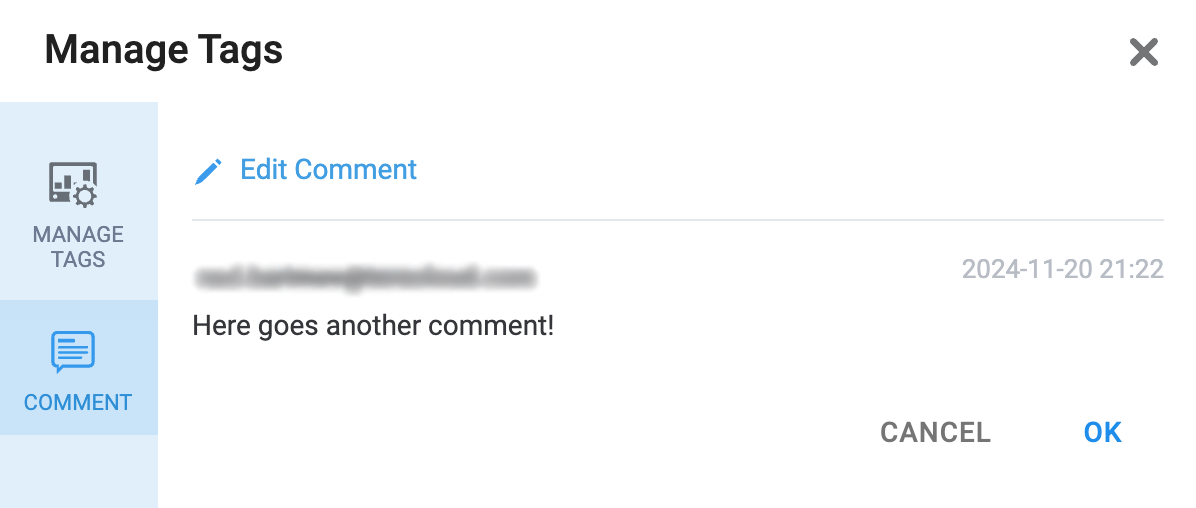 |
Fig. 11. This comment is for an object.
Object comments are otherwise managed the same way as page-wide comments; they can be later found by opening the object’s dialog.
OTHER TOOLS…
… can be found in the page viewer that we couldn’t cover in this guide; check them out!