HMI
This is an introduction to our collection of HMI guides. A more complete set of HMI manuals can be found here.
When working with a project based in the Cloud, whether with an on-site Edge server or its Cloud-native alternative, most of your interactions will take place in the HMI.
- HMI
- One of the two web apps that make up the Cloud; the other one is the Portal.
While there are some things you can do in both apps, they generally serve different purposes. Mainly:
- With HMI, you access and work with a single project.
- You cannot create new assets within the project, that’s what the Portal is for.
- However, you can use the assets configured for the project and manipulate them to keep your project healthy.
- HMI also has tools for retrospective analytics.
HMI Basics
When you first open the HMI, it opens the default page in the page viewer. Let us analyze what we can find in the interface.
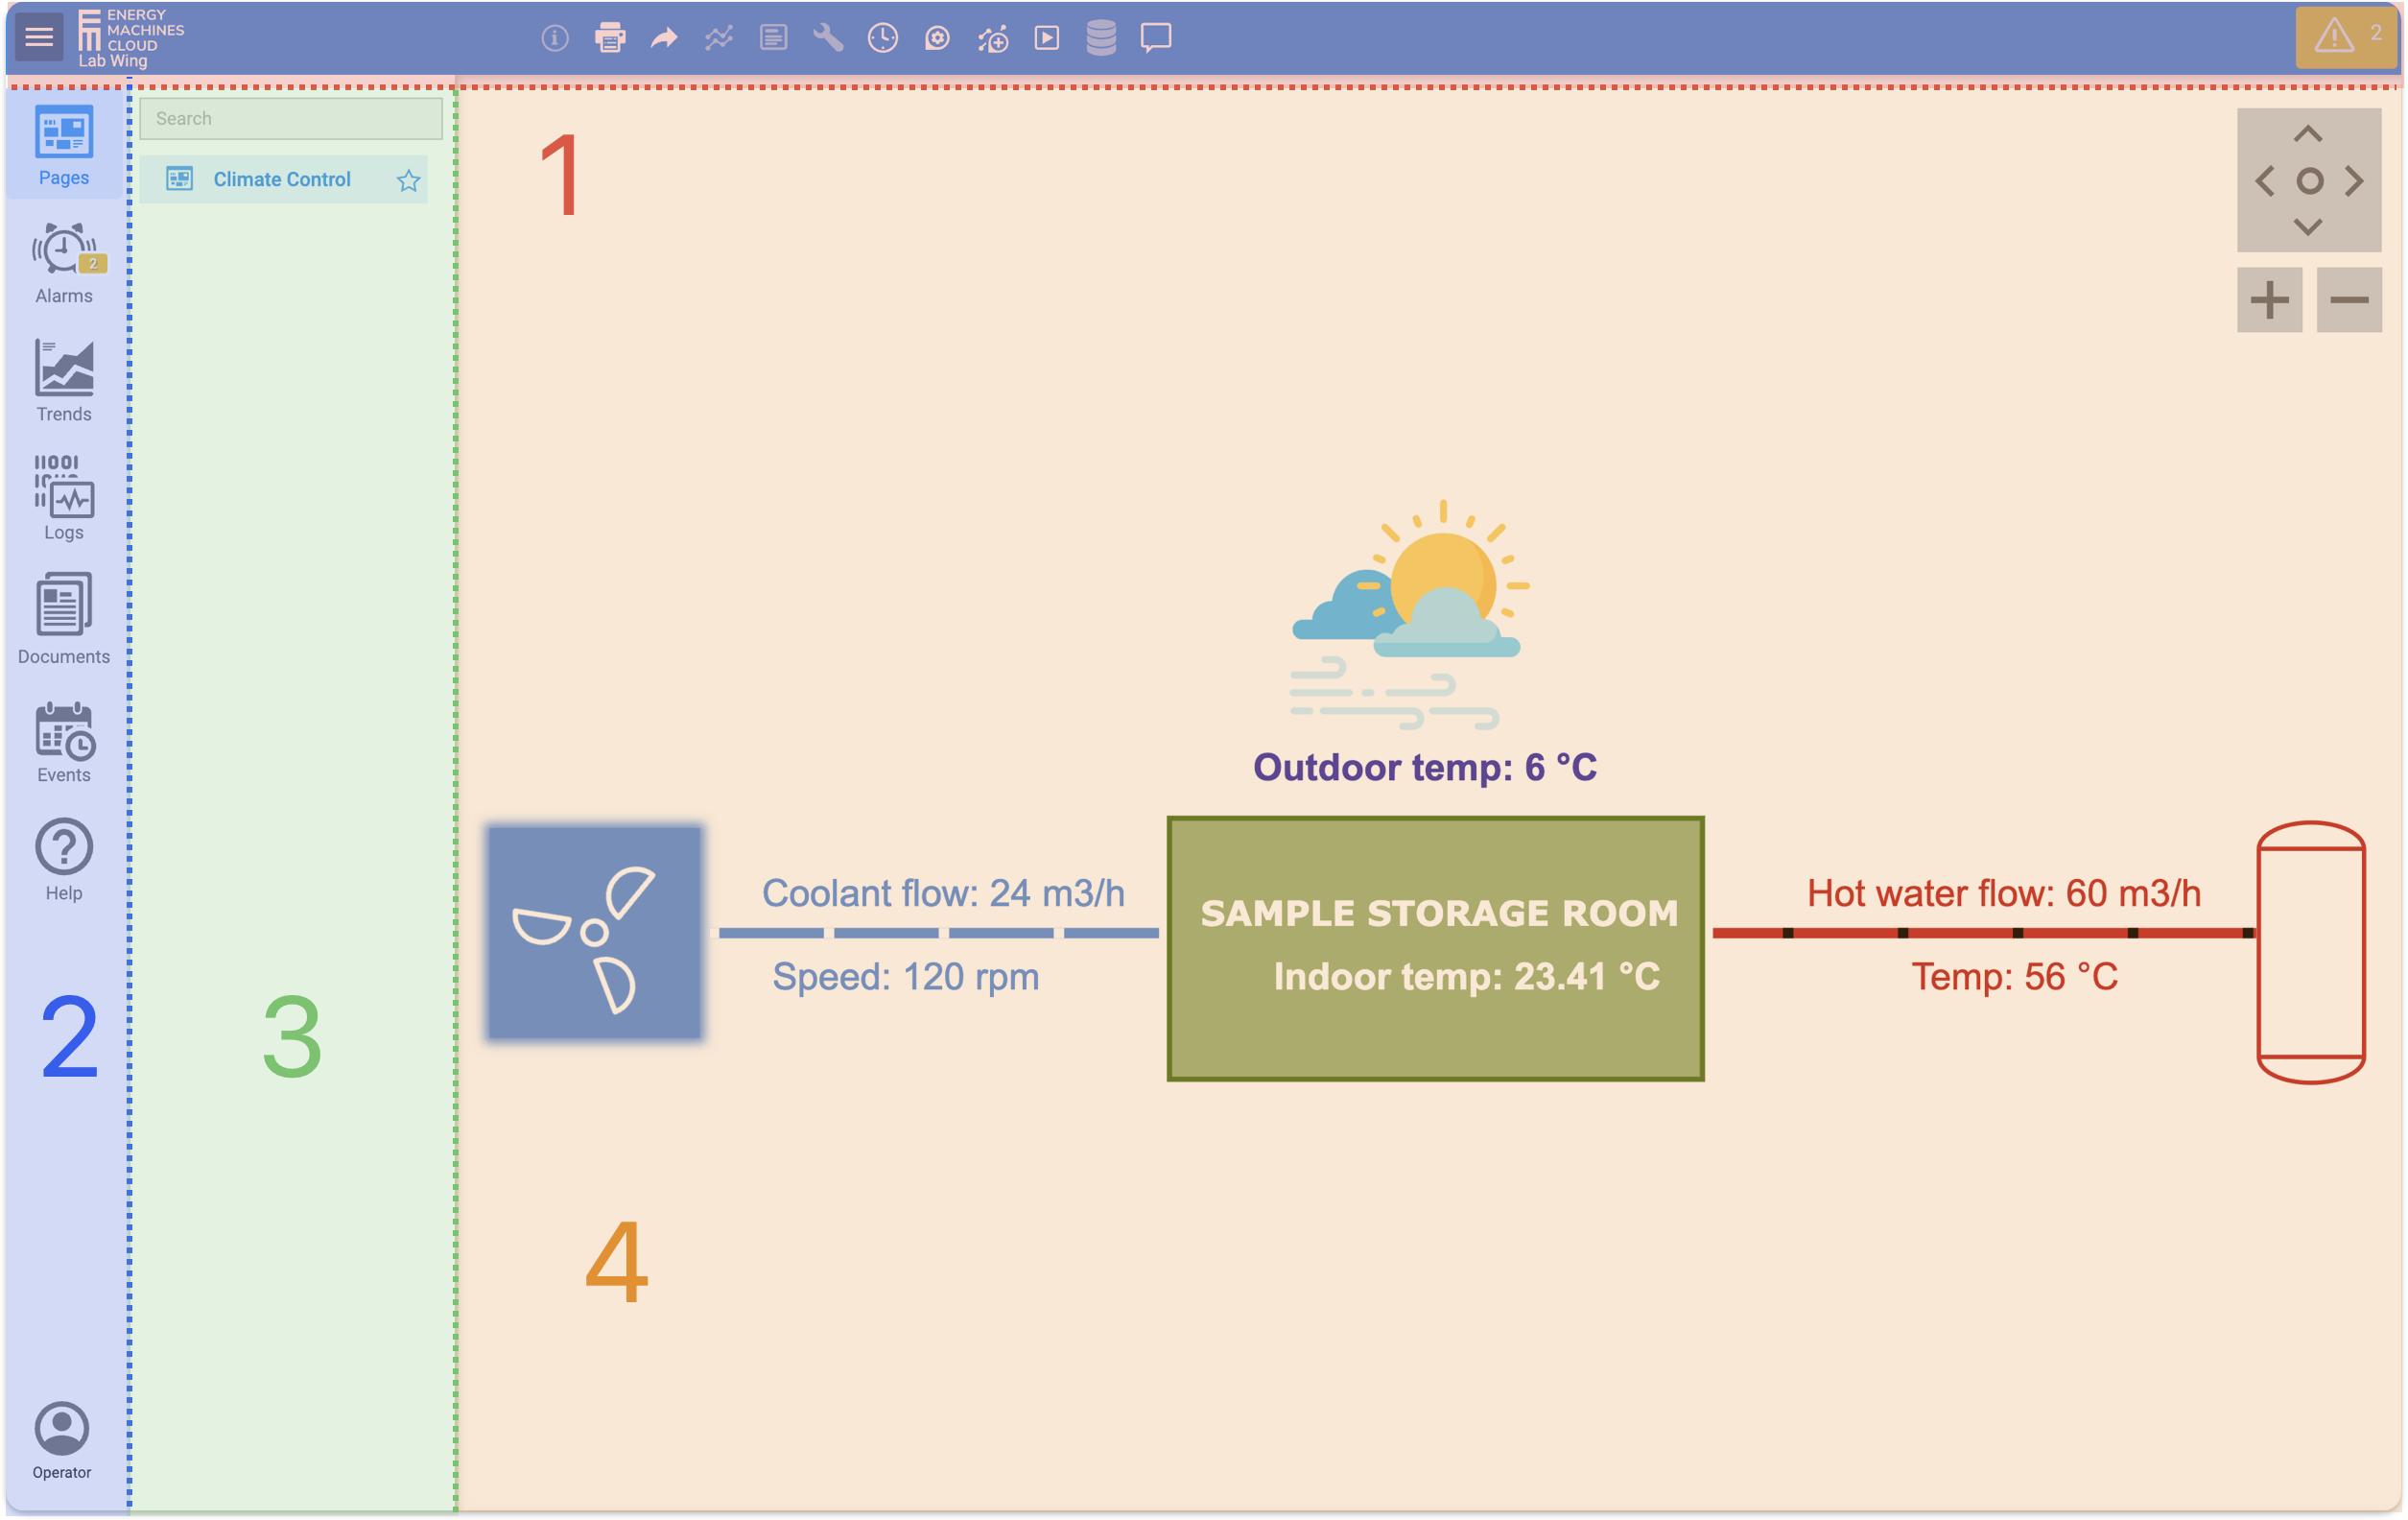
Fig. 1. Let's dissect what we see here.
Header Toolbar
Contains all the tools relevant to the active view of the HMI. While some tools are available across all views, most of them are specific to each particular view.
Additionally, the header toolbar displays the current global status of the project’s alarms in the right corner, see How Do I Know an Alarm?
Menu
Lists the different views, or sections, of the HMI and allows switching between them:
- Page viewer, which also integrates tag management tools and history playback.
- Shows alarm status and statistics, provides tools for handling the alarms.
- Highly customizable graphs of current and historical tag values
- Timestamped history of user activity and system-recorded events.
- PDF files shared with you by other users of the project.
- Calendar of the project's events.
You can also see two additional items in the menu:
- links to this documentation (opens in a new tab).
- shows a pop-up menu with some view parameters and an option to log out.
Navigation
Enumerates the items pertinent to the active view: pages in in , alarms in , etc. If those are arranged into folders, this arrangement is preserved. Search is available and may come in handy if the project has many assets.
In some views, navigation provides filtering options and even additional tools for creating and/or editing the associated items, such as events or trends. However, these do not become project assets.
Viewer
This is where most of the activity happens. It’s where you see the contents of a page, the list of active alarms, the log tables, the trend graphs, etc. Depending on the active view, the viewer provides additional tools for navigating the shown content, filtering out what’s not relevant at the moment, or even creating new visuals — like freshly plotted graphs.
Keep reading the guides in this collection to learn more about each section of the HMI and the tools available in them.
Demo Setup
The guides about HMI, which you’ll find listed further below, use a simple demo project called Lab Wing. The project is a virtual laboratory room, which has a basic climate control system of four components:
- Cooling fan
- Cooling pump
- Heater
- Hot water pump
Cooling fan and pump remove heat from the laboratory space, so increasing their output will lower the temperature. On the contrary, the heater and the hot water pump produce heat and add it to the room. Thus, increasing their output will result in a higher temperature.
Additionally, the temperature is affected by the weather outside. It’s a simple linear relationship: colder weather means colder indoor space, and vice-a-versa. Weather data is continually retrieved from public sources for the virtual lab’s location, which is downtown Copenhagen.
The project’s single page, Climate Control, presents us with all the data:
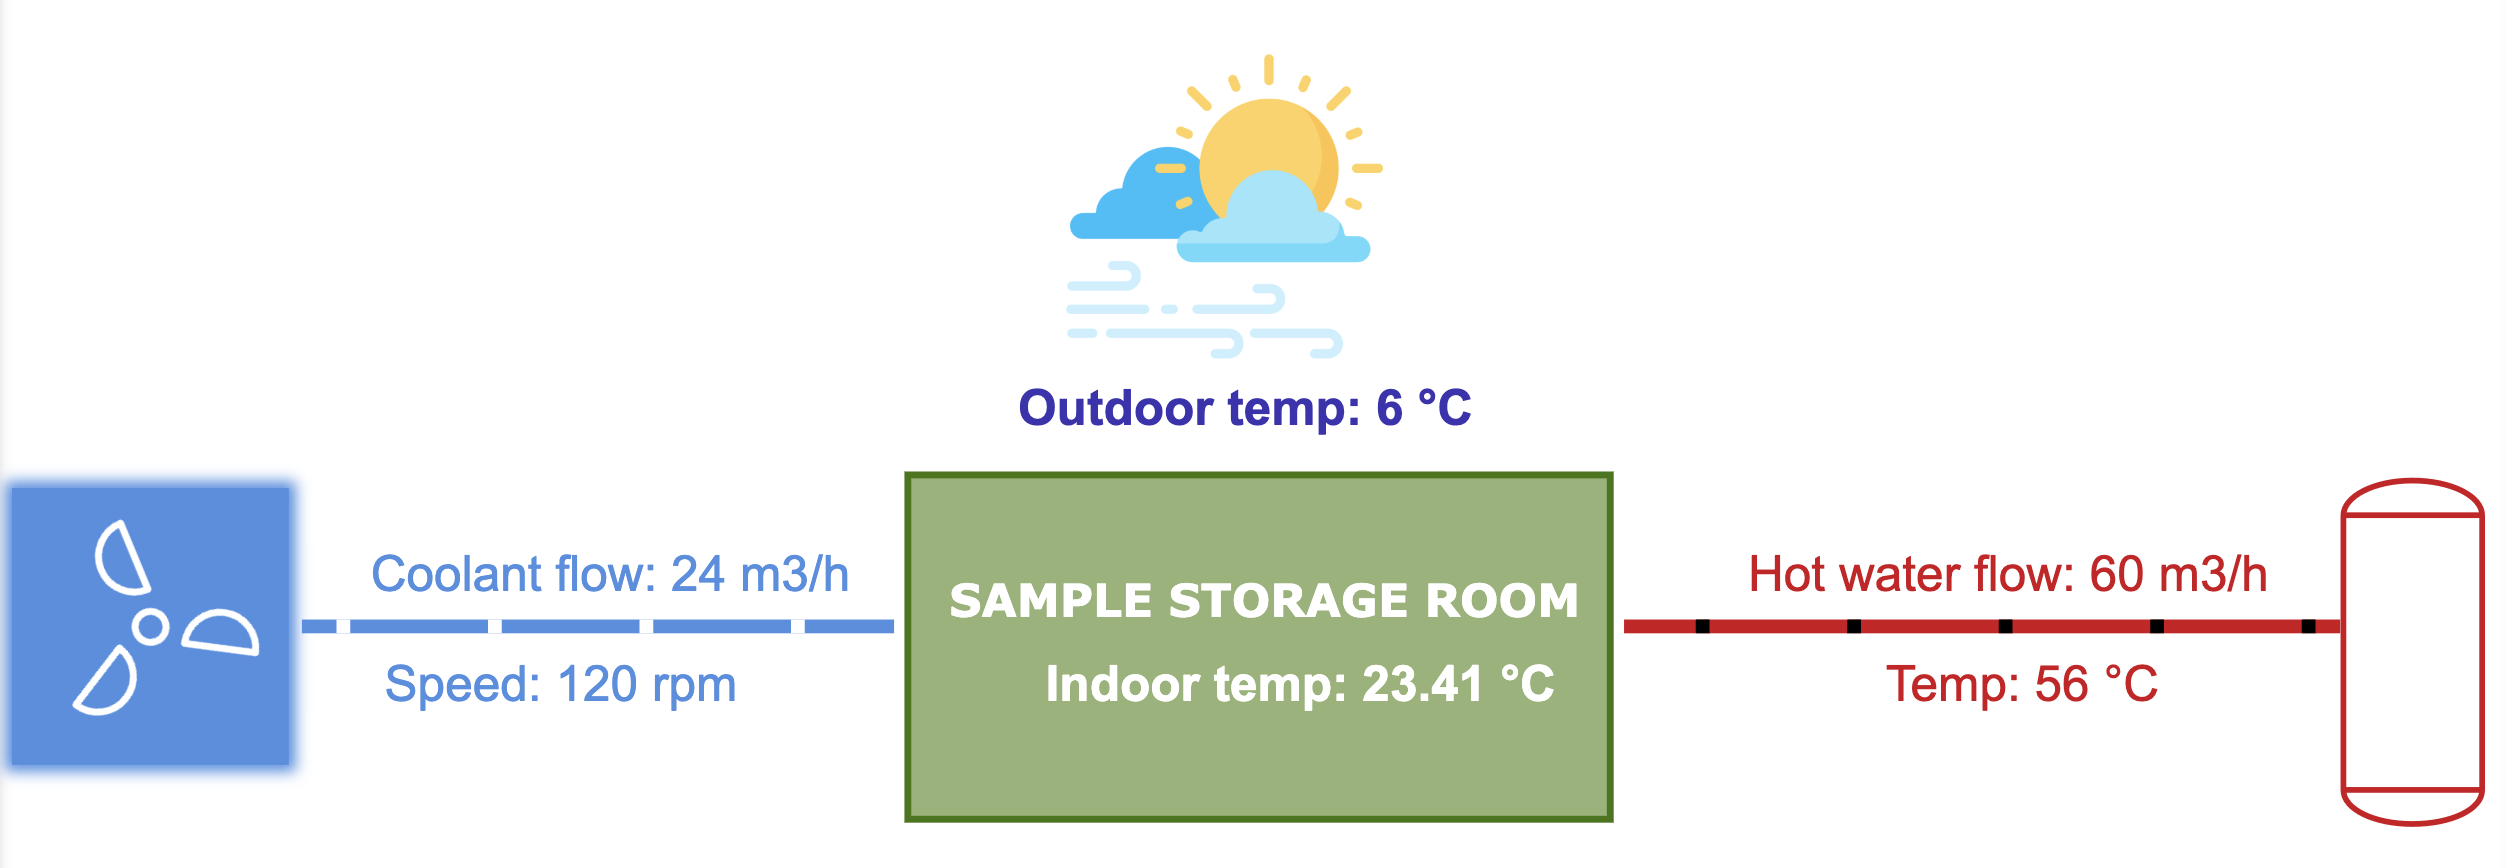
Fig. 2. Sample storage needs an optimal temperature to operate!
Thus, the critical parameter of the room is the temperature in the sample storage facility, which depends on four parameters that users can control, and one parameter that they cannot. Our task is to keep it within th optimal operating range and to respond quickly to undesirable changes in temperature. While we cannot control the weather, we can still adjust our climate control settings accordingly. To that end, the project has:
Four writable tags:
| Tag | Label | Description |
|---|---|---|
Cooling Circuit/Fan |
Controls the speed of the cooling fan in rpm
|
|
Cooling Circuit/Pump |
Controls the coolant flow rate in m3/h
|
|
Heating Circuit/Heater |
Controls the temperature of the heater | |
Hot water flow |
Controls the flow of hot water in m3/h
|
Two non-writable tags:
| Tag | Label | Description |
|---|---|---|
Thermometers/Temperature |
Displays the resulting indoor temperature, in ºC | |
Thermometers/Weather |
Displays the outdoor temperature at the laboratory’s location, in ºC |
And finally, two alarms:
-
Triggers whenThermometers/Temperaturereads < 22 ºC. -
Triggers whenThermometers/Temperaturereads > 24 ºC.
Thus, the temperature in the sample storage area must be within $ [22,24] $, in ºC, to avoid triggering alarms. If one of them does trigger, we’ll see that by change in the outline of the associated object on the page:
|
|
| Blinking red outline means this alarm is active. If someone acknowledges it, it will stop blinking. See How Do I Know an Alarm? for other indicators of active alarms. | |
We’ll use this project and its assets to demonstrate the tools you can find in the HMI for your own project maintenance.
Table of contents
- Work With Pages - Look at your project like it's a canvas. Write values to tags and replay their history down to minutes. Leave your comments for others to see.
- Handle Alarms - Learn what to do when you see an alarm and how to investigate alarms retrospectively.
- Analyze Trends - Plot sophisticated graphs to visualize the relationships between your tags.
- Extra Tools - for greater opportunities: check logs, schedule jobs on your project, and more.