Handle Alarms
This is an introductory guide; for a complete manual on this interface, see HMI » Alarms.
When working with a project, you might encounter an alarm. This means that an anomaly has been detected with one or more Tags. The nature of this anomaly may vary:
- A tag tied to some temperature sensor shows the room is too cold or too hot, with respect to the setpointUser-defined value that provides an operational threshold for a variety of uses.,
- A device is sending readings that change too frequently or too abruptly,
- An IP node fails to respond in good time,
etc. These are some of the possible situations that may raise an alarm in the system. This article will guide you through the process of addressing such situations with the help of HMI.
Quick Links
This article covers the handling of alarms in HMI. You might also be interested in Alarms and its daughter articles for a complete set of manuals on alarms. Links to other relevant parts of this documentation can be found throughout the article.
We’ll be using the Demo Setup — a laboratory room where the indoor temperature must be kept between 22 ºC and 24 ºC. Two alarms have been configured for it:
-
Temperature in the lab is below 22 ºC. -
Temperature in the lab is above 24 ºC.
These alarms will be referenced further in this guide.
How Do I Know an Alarm?
Once an alarm is triggered, HMI will provide special visual clues:
- the alarm count badge in the header bar changes color and starts blinking;
- a smaller badge also appears in the sidebar on top of .
 |
 |
||
| Blinking counter in the Header | Bouncing badge in the sidebar | ||
RED |
Indicates there are active alarms, shows the number of such. | ||
YELLOW |
Indicates there are no active alarms, but some have not been acknowledged since the last activation; shows the number of such. | ||
Additionally, if alarms are attached to an object on your page, it will add a red outline to the object while active:
|
|
| Blinking red outline means this alarm is active. If someone acknowledges it, it will stop blinking. | |
Finally, you may also opt to receive notifications when an alarm goes off; in this case, you’ll get an email on alarm activation with the following information:
- Alarm metadata, including project name
- Activation time
- Affected tags
- Last comment on the alarm, if present; see the next section.
See Keep Me Posted! for guidelines on how to subscribe to notifications.
One important thing about an alarm is its state (or status). The Cloud distinguishes between five alarm states:
Note the colors: the HMI interface uses the same color codes to indicate alarm status. You’ll see the same flairs in this guide and elsewhere in the documentation, wherever alarms are concerned.
For any alarm-related activity, you want to go to . You can also open this interface by clicking on the counter in the header. Once there, you’ll see the navigation pane listing all alarms configured for the project. The pane has two tabs:
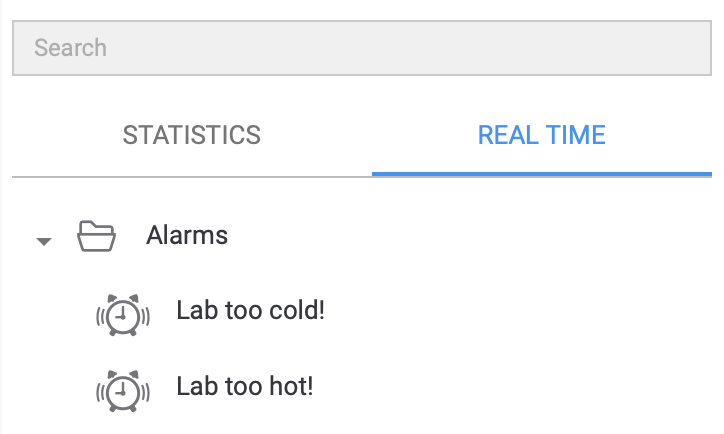 |
— Status and Actions Panel with metadata and tools for resolving alarms. This tab opens by default. |
| — Statistical charts with access to alarm logs. |
Continue reading to find out what each tab provides.
Alarm, Alarm! What Do I Do?
For a complete reference on alarm statuses and actions, see Status and Actions Panel.
- Where
- »
The primary alarm interface, which we refer to as the Status and Actions Panel, or simply the SAP, can be divided into four areas:
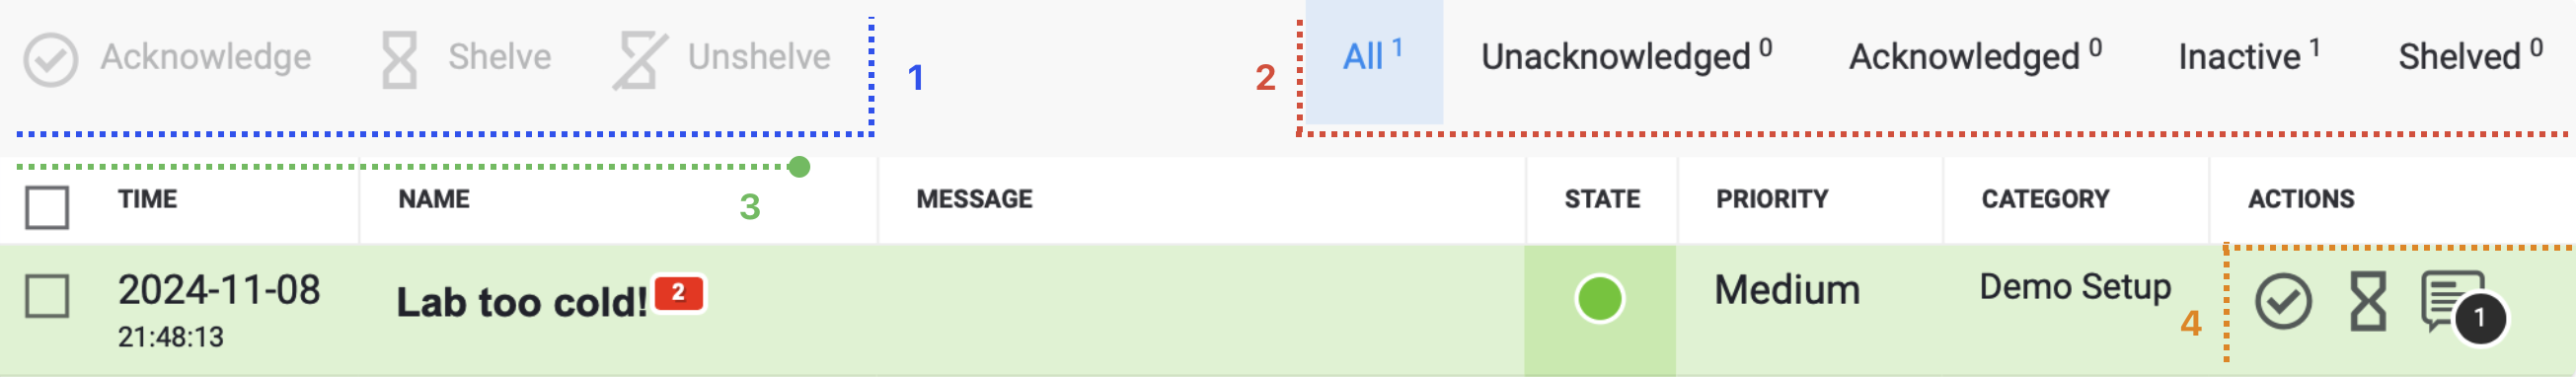
Fig. 1. Elements of the SAP.
-
Apply actions to all selected alarms. Actions change alarm status. -
Apply filters based on alarm status, with a counter for each status type. -
Shows alarm metadata and provides checkboxes for selection. Alarms can be selected individually; the topmost checkbox selects all alarms on the list. -
A set of action buttons for each alarm on the list.
By default, the SAP shows all alarms whose state is other than or . However, you can click on an alarm in the navigation pane to see only its instances. You can also click on a folder to see all alarms in that folder:
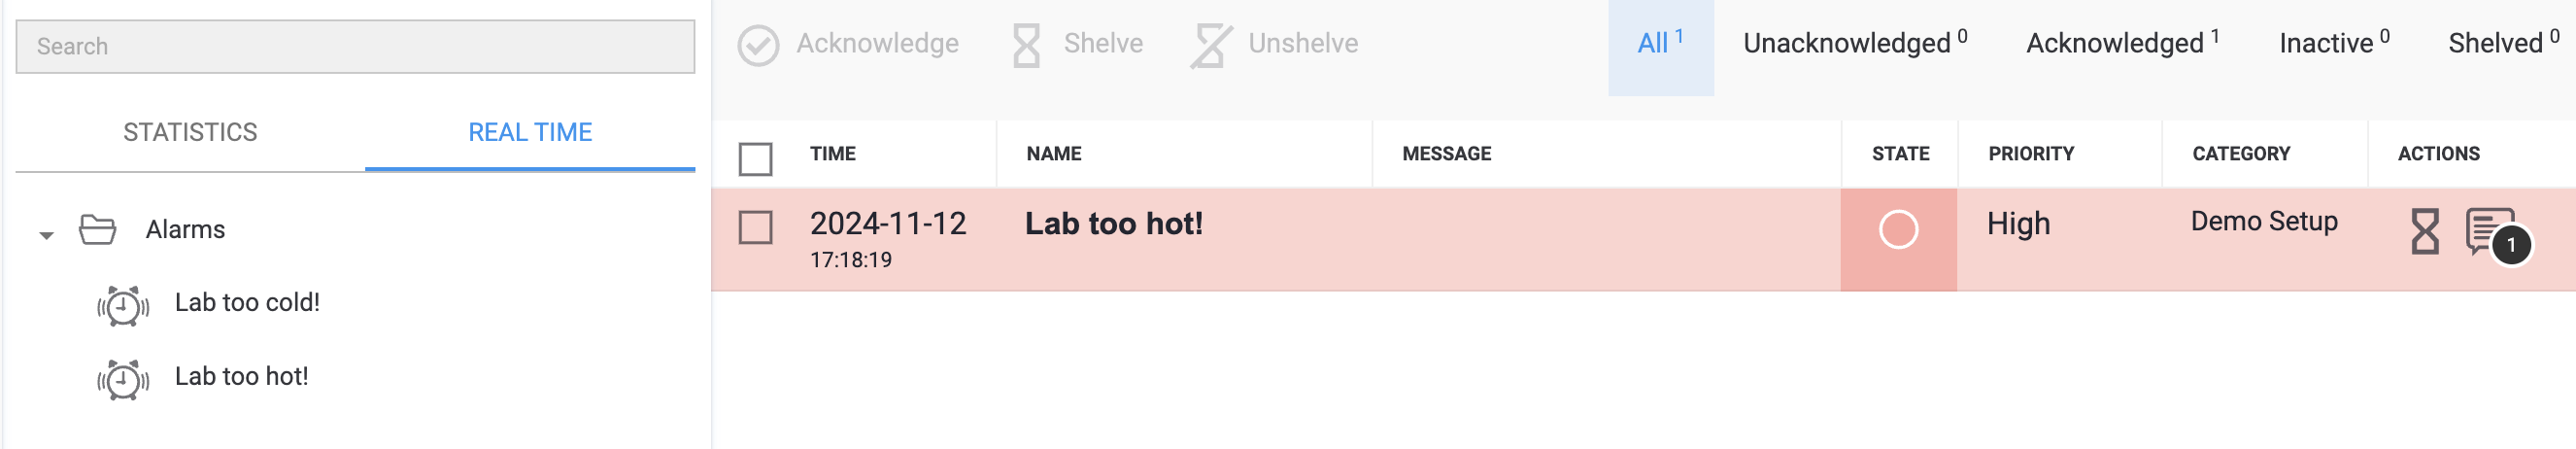
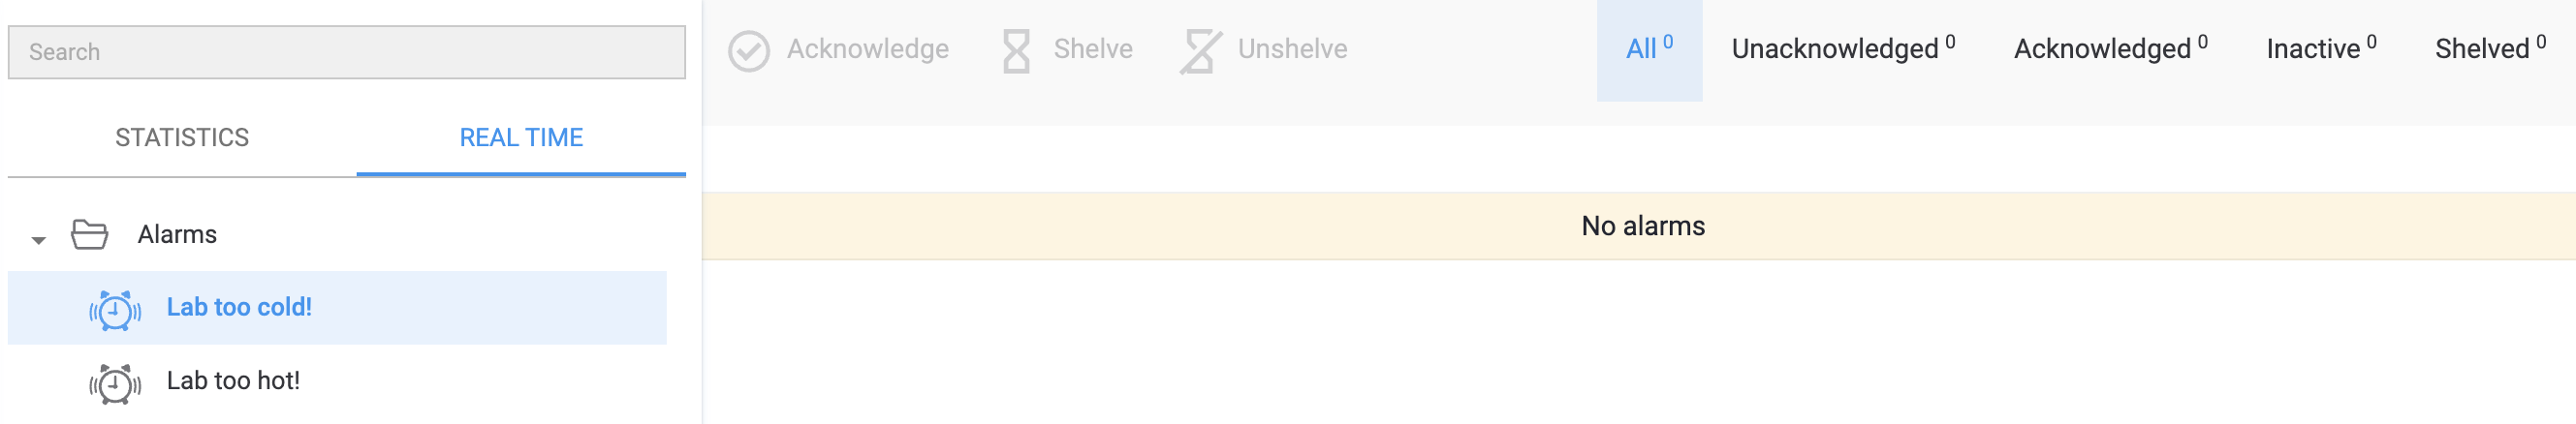
Fig. 2. Default display of alarms (top) vs. instances of one alarm only (bottom). Note the highlights in the navigation. The list is empty since this particular alarm has no current active instances.
When an alarm is triggered, its state is altered:
→
Depending on the, you might not want to keep an alarm in this state. The HMI has tools for you to change the state, directly or indirectly. Here are the things you could do about an alarm:
Acknowledge
Acknowledging an alarm essentially means telling the system and other users you are aware that it happened. You might want to use this tool when you start working on addressing the alarm. Besides, an alarm is not considered fully resolved until it is acknowledged, even if the underlying problem no longer persists.
Select the alarm(s) you want to acknowledge and click on in the toolbar above the list. Alternatively, you can click on under to apply this change to a single alarm without selecting it.
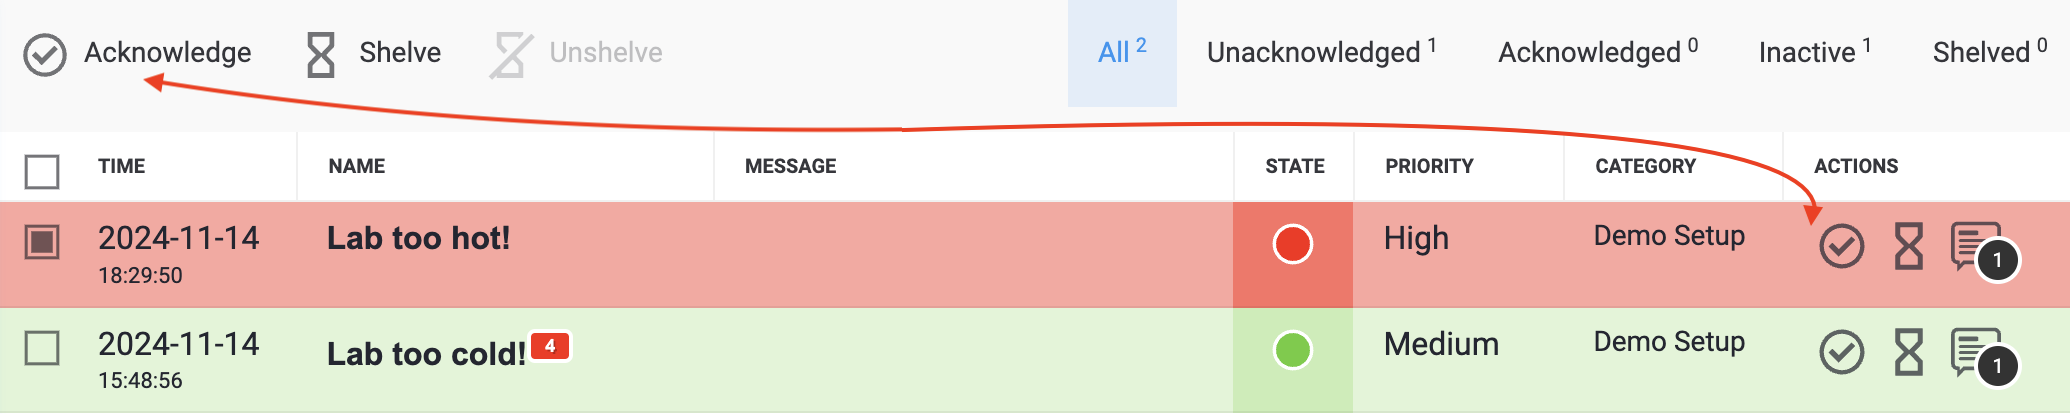
Fig. 3. Two buttons hav the same effect but different scope.
Note the states: one alarm is , as its cause persists. The other alarm is , since its cause has been addressed but the alarm itself has not been acknowledged. If an alarm has been triggered repeatedly without acknowledgement, a small subcount badge will indicate how many times it has happened — in this case, 4.
Acknowledgment does not mean the alarm is “gone”; it only shows other users someone has seen the alarm and is aware of it.
Depending on your access level, acknowledgment might be outright unavailable to you or require a comment, in which case you will be asked to provide one. Note that comments persist through multiple alarm instances; your previous comments will become visible when the alarm pops up on the list again.
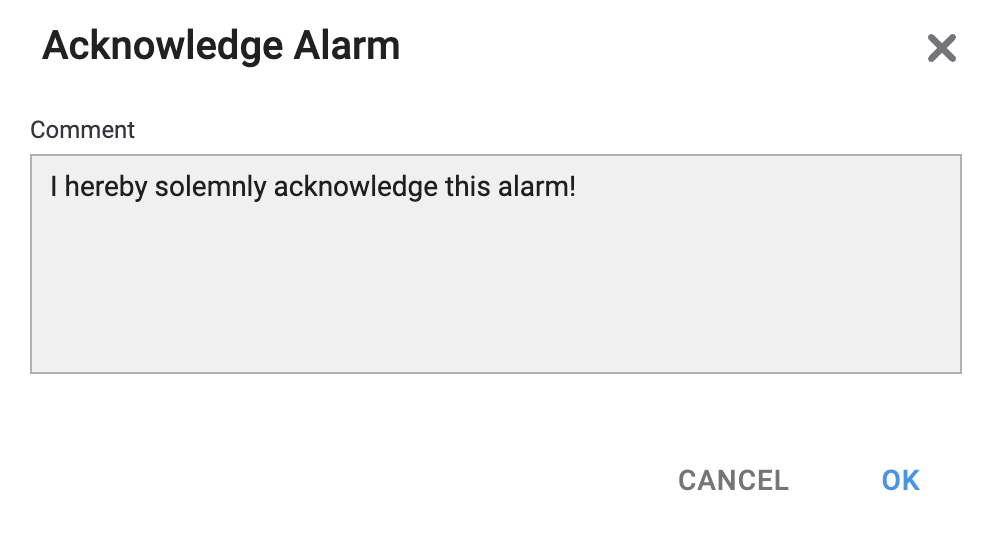
Fig. 4. A comment is a simple text that will be stored with a timestamp.
Upon acknowledgment, the alarm state changes as follows:
→
If the alarm had already been addressed before acknowledgment, its state will change as follows:
→
causing the alarm to disappear from the list until the next time it is triggered.
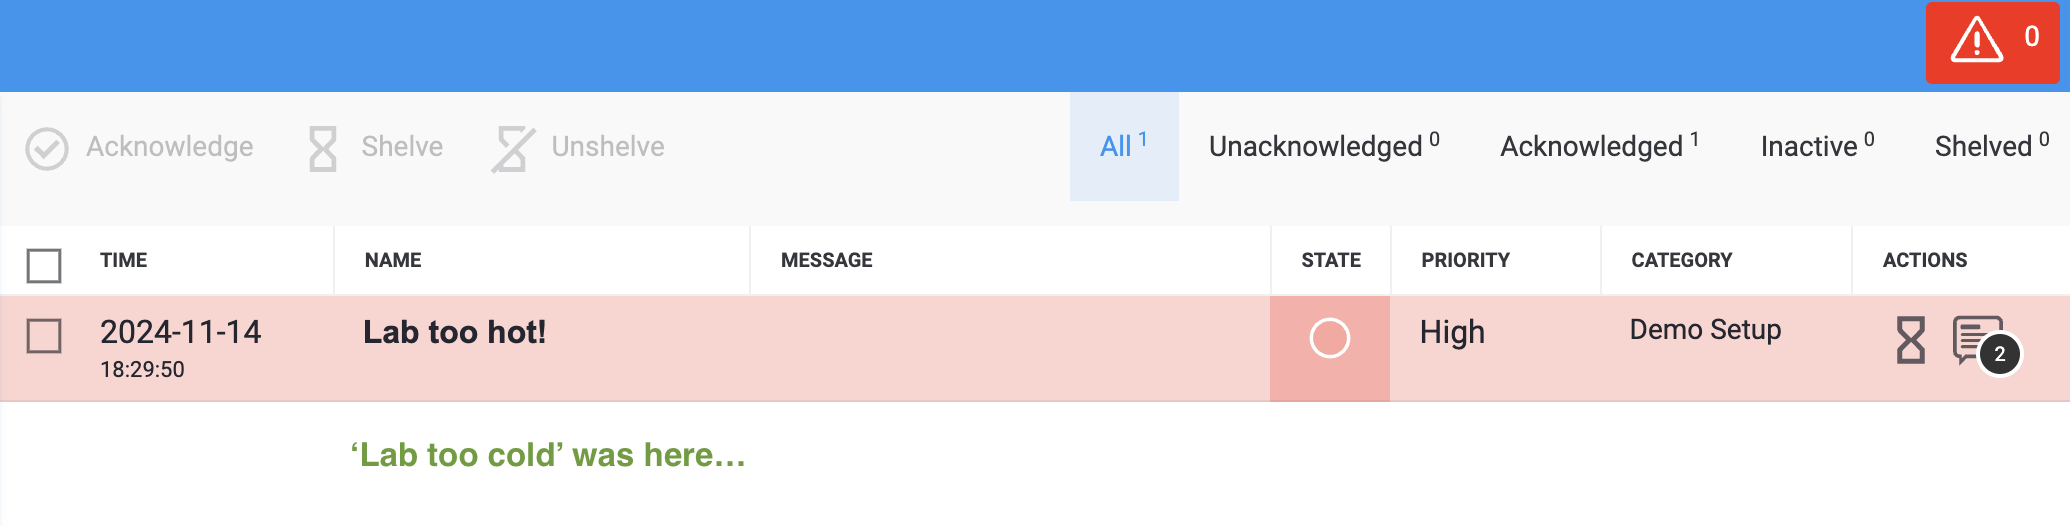
Fig. 5. Acknowledgment has different effects depending on whether the alarm was active or not.
Note the counter: acknowledgment alters the alarm count; however, even if all alarms have been acknowledged, color-based indication persists as long as any alarm is active.
Acknowledgment is not reversible! Once acknowledged — forever acknowledged. Well, until the next activation, that is.
Resolve
This part provides an example of tag management. For a more detailed coverage of the mentioned tools, see Write to Tags.
So far we’ve learned that an alarm can be acknowledged, which tells other users someone has seen the alarm and confirmed that work on it is in progress (or whatever else that user might have indicated in the comments). It still needs to be resolved though. To that end, you want to investigate the cause of the alarm.
Let us go back to and see what’s happening there.
Fig. 6. 27.5 ºC is definitely not acceptable for this laboratory room.
In our case, the whole setup is relatively simple, and the alarm is caused because the temperature in the laboratory premises is too high. The entire setup of the room is covered in Demo Setup. In brief, there are four writable tags that can affect the room temperature, which triggers the alarm:
Cooling Circuit/Fan and Cooling Circuit/Pump1
|
Higher values lower the temperature. |
Heating Circuit/Heater and Heating Circuit/Pump
|
Higher values cause the temperature to rise. |
To fully resolve the alarm, we need to bring the room back into its desired temperature range, which is between 22 ºC and 24 ºC. To do so, let us try to speed up the fan and lower the heater temperature. One simple way to do so is to use in the toolbar above the page.
You’ll see the full list of tags in the project organized in folders. Folders can be expanded or collapsed, if necessary. When working on a bigger project with hundreds of tags, the Search field atop might come in handy as well.
Find the tags you need to rewrite their values:
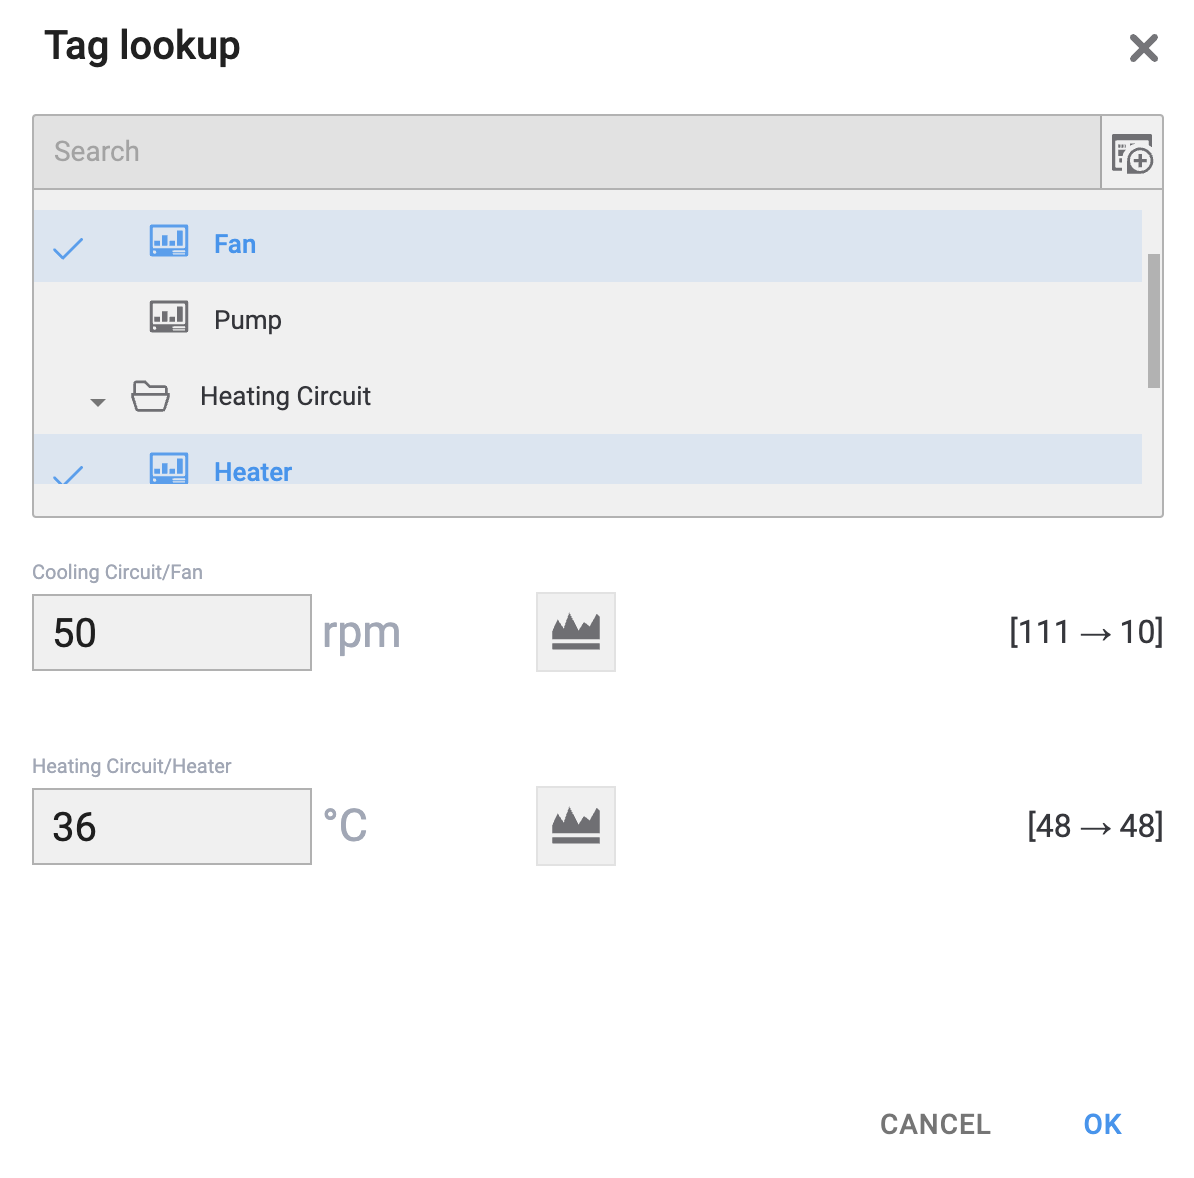
Fig. 7. You can also see previously written changes in tag values here.
Let’s see if racking up the fan speed to 70 would cool down the room and bring it within the adequate range:
Fig. 8. Now it's proper!
Once all alarms have been acknowledged and their underlying reason addressed, the list will become empty again, and the alarming red or yellow counter badges won’t disturb you anymore… until next time.
Shelve
Shelving an alarm temporarily moves it to a special list without otherwise affecting it. This can be useful when you want to ignore an alarm for a certain time and can safely do so, for example:
- you are doing some maintenance work and might deliberately create alarm-triggering conditions
- you are working on the cause of the alarm and want to ‘silence’ it in order to declutter the visuals in the HMI
Select the alarm(s) you want to shelve and click on in the toolbar above the list. Alternatively, you can click on under to apply this change to a single alarm without selecting it.
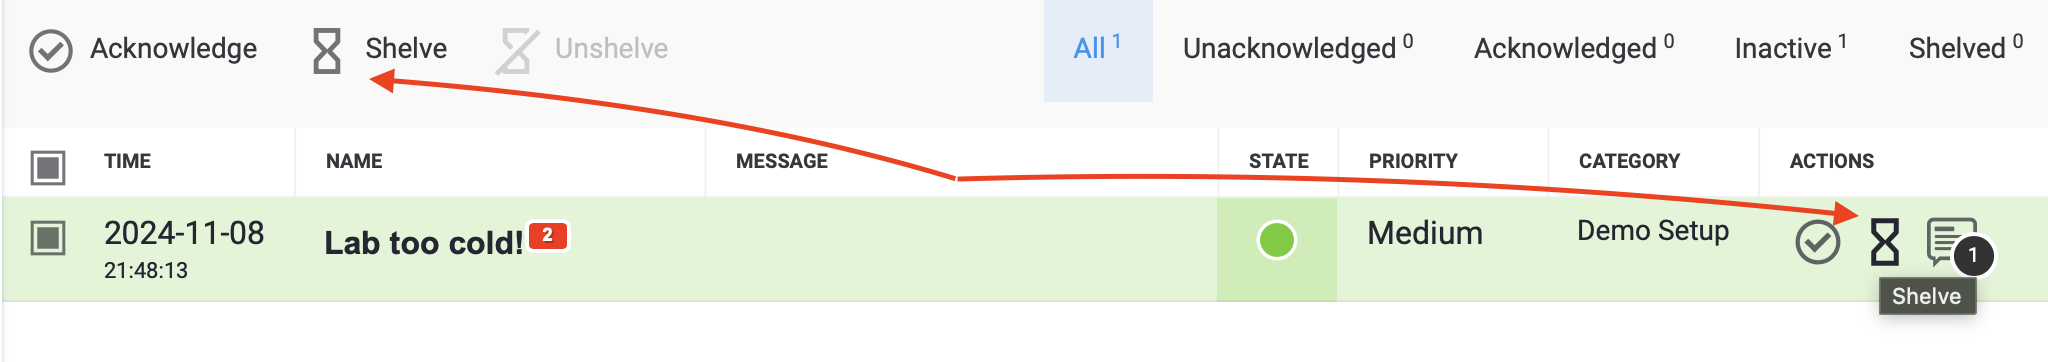
Fig. 9. Two buttons have the same effect but different scope.
You’ll be asked for how long the alarm should stay shelved; the default duration is one (1) hour, but you can specify any duration you want, in Days and Hours. However, an alarm cannot be shelved indefinitely.
Alarm status will change as follows:
••→
Unlike acknowledgment, shelving does not require any special permissions as long as the user is allowed to see the alarm at all.
When an alarm is shelved, it no longer counts towards the alarm counter, and the HMI generally behaves like it never happened in the first place. Thus, regardless of its status before shelving, the alarm will not be listed anywhere except on the Shelved sublistList of alarms filtered by status..
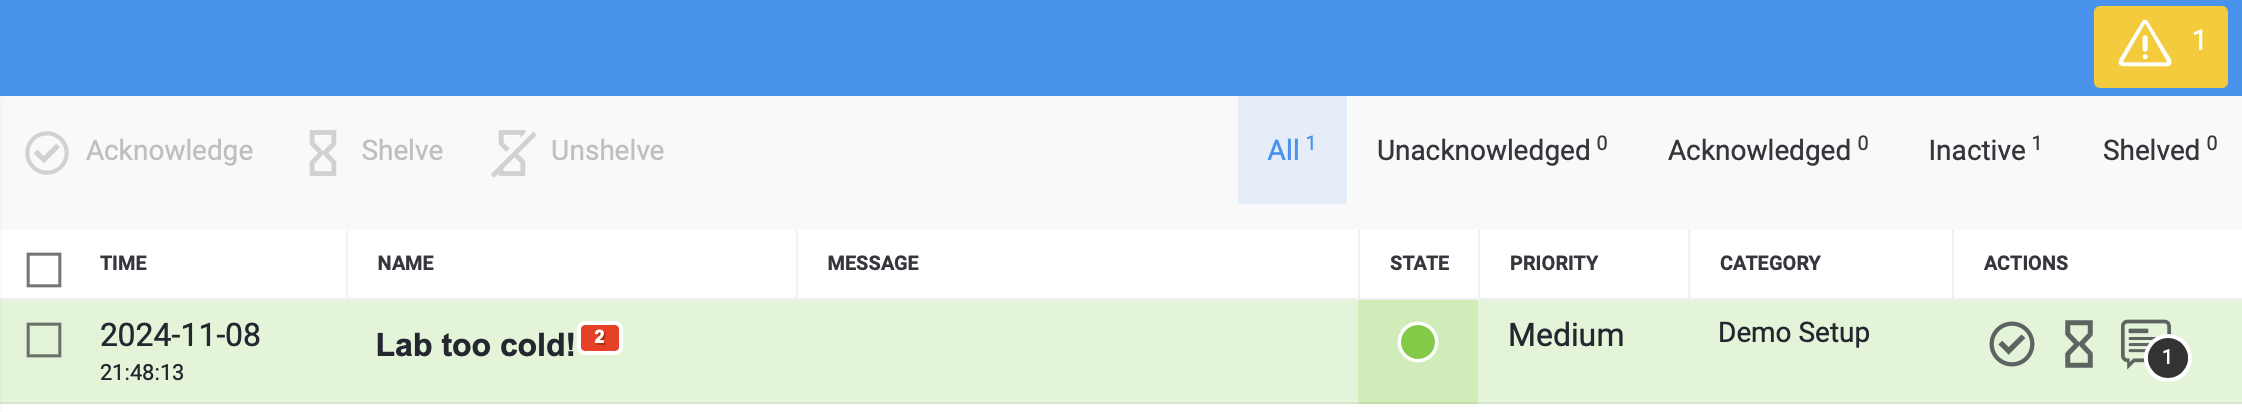
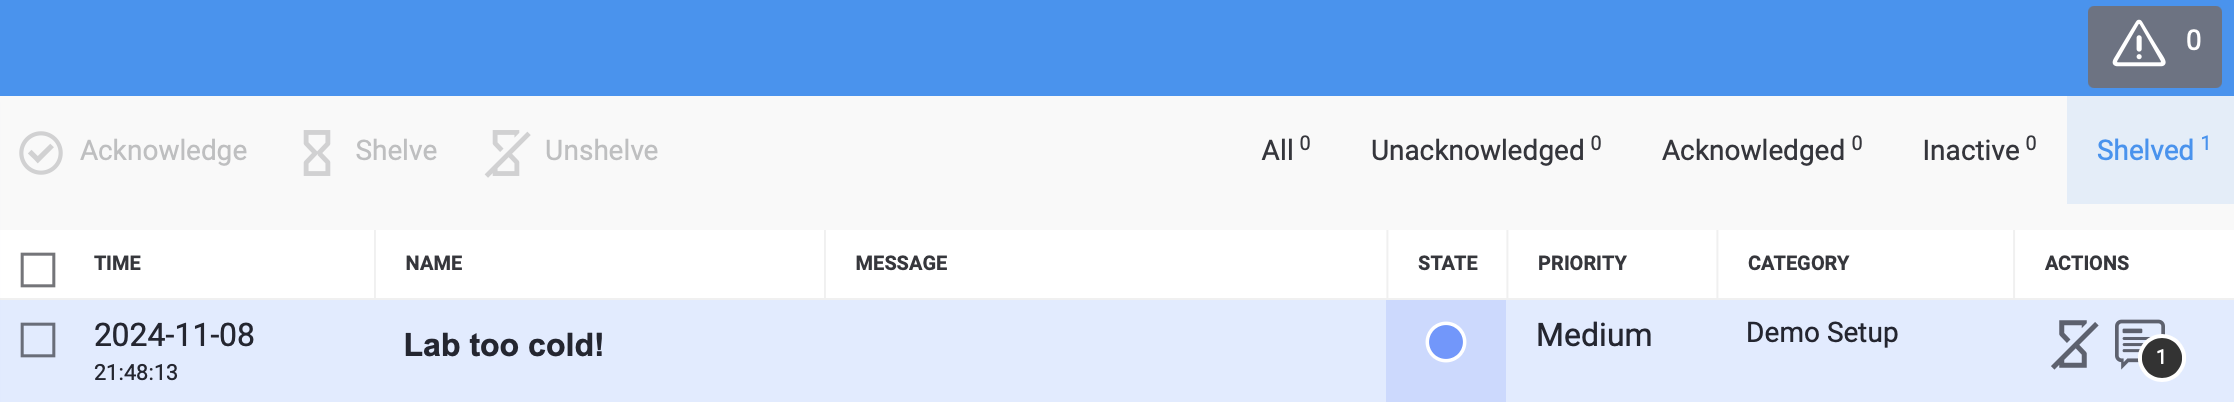
Fig. 10. A shelved alarm moves to the Shelved sublist and disappears everywhere else. Note the change in the counter.
To unshelve an alarm, click on either in the toolbar (requires selecting one or more alarms) or under (affects a single alarm). This will move the alarm back to the main listUnfiltered list, which contains all non-shelved alarms. and increase the alarm counter accordingly.
Although shelved alarms are no longer indicated by the counter, you still have to find out their cause and proceed accordingly. It is also not recommended to shelve for extended periods of time.
Can I Get Some Stats?
HMI has some neat tools for retrospective analysis of alarms.
- Where
- »
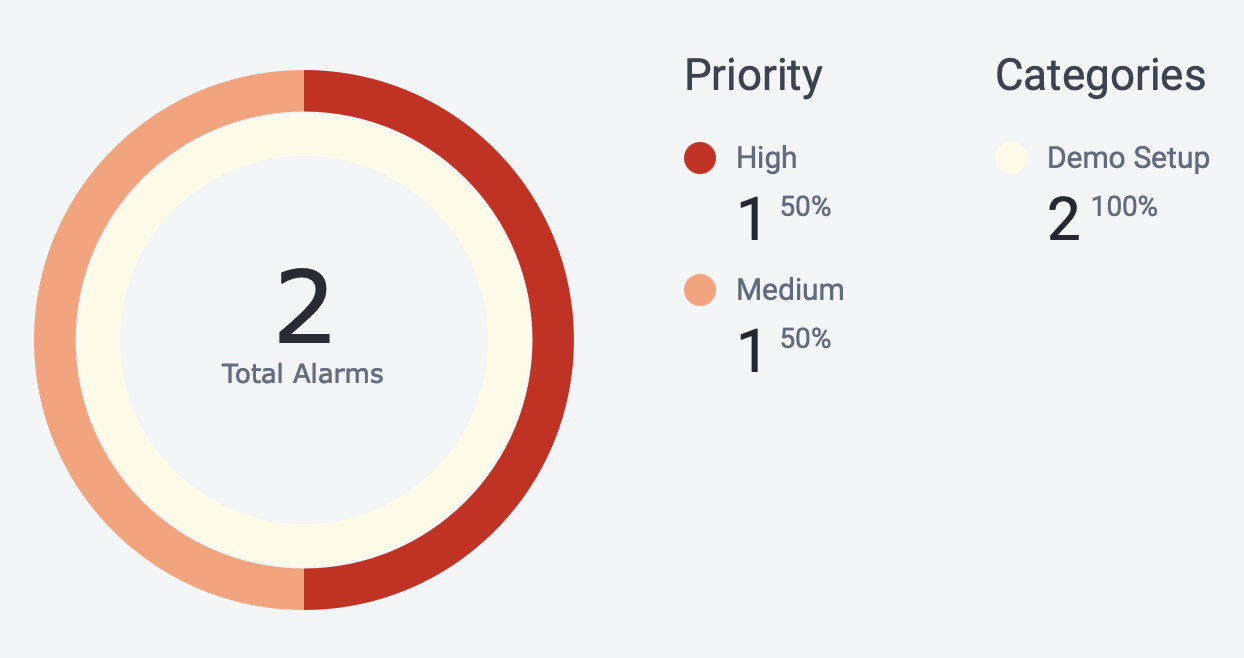
The default view of this interface will greet you with two pie charts:
-
Shows the number of alarms whose status anything other than. This pie chart visualizes the distribution of such alarms by priority and category. -
Shows the number of alarms whose status is anything other thanor. This pie chart visualizes the distribution of such alarms by status. Note that while the count on this pie chart is exclusive ofalarms, their proportion is still shown both graphically and numerically.
 |
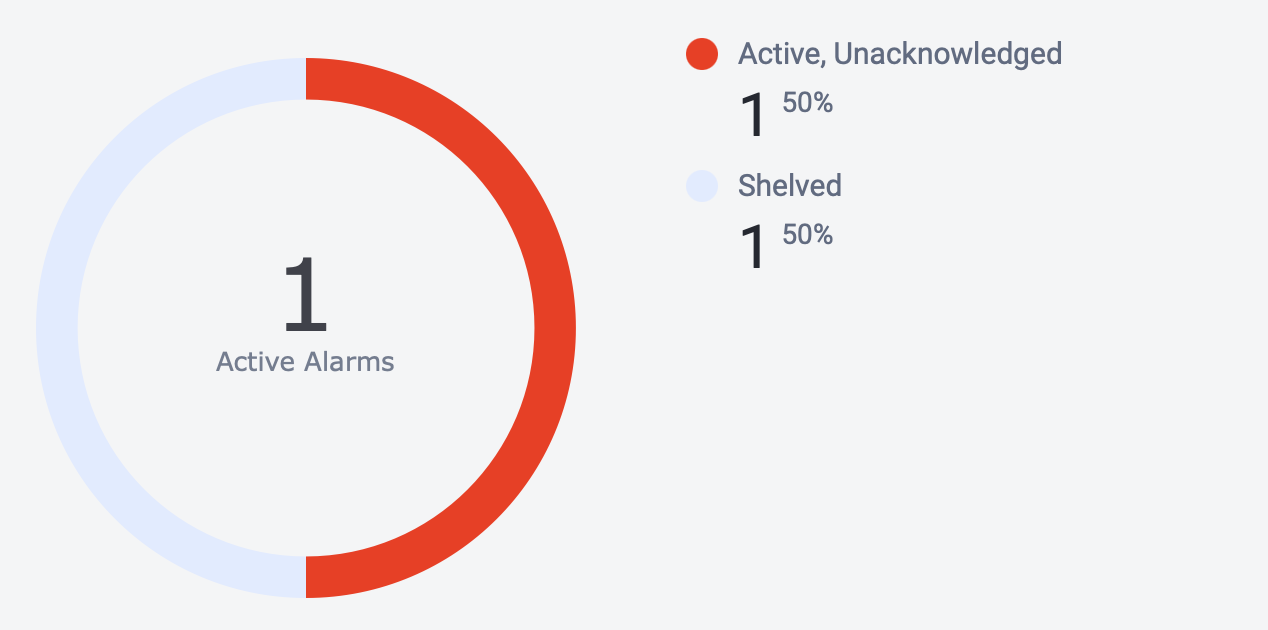 |
Fig. 11. Two pie charts summarizes the current state of the art.
Further down you’ll see : a horizontal bar chart showing the distribution of alarm occurrences in a given time period. You can set the time period in the datetime picker above the chart.
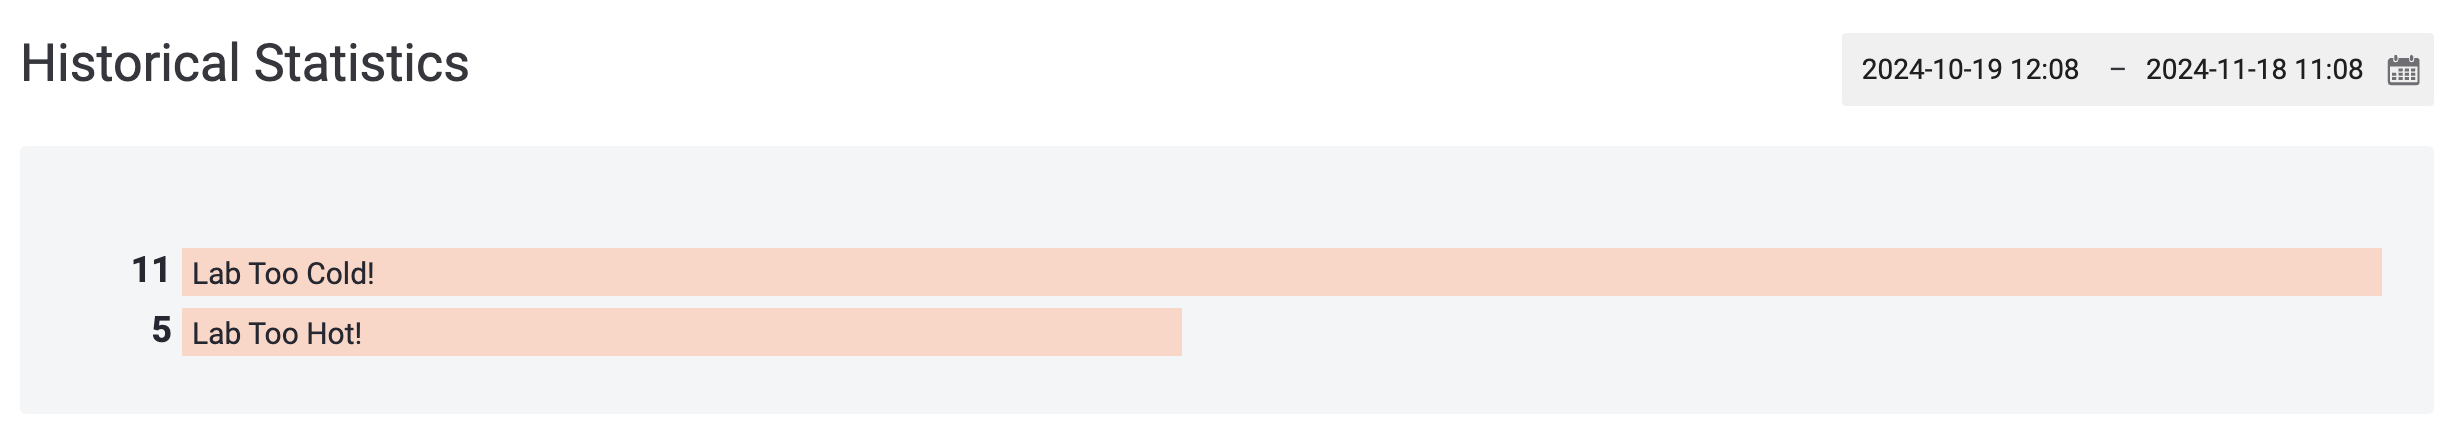
Fig. 12. Between October 19th and November 18th, 2019, the laboratory room was too cold 11 times and too hot 5 times.
You can further click on a bar to open the history of the alarm it represents. The history table will least all events of this alarm that took place in the selected time period, including:
- Activation and deactivation due to changes in the condition
- Acknowledgment, shelving and unshelving
with timestamps and some of the metadata. You’ll be also able to see:
- the alarm-observed tag as and its value at the moment of the event as
- the name of the user that performed a manual action on the alarm (acknowledgment, shelving, or unshelving) as
LOCAL user means the action was performed via local HMI. For system-initiated events such as activation or deactivation due to change in conditions, no username is recorded.
Similarly to the other tab, you’ll see a list of all alarms configured for the project and organized into folders. Clicking on an alarm in this list will also take you to its history, with only one small difference:
- The default time period under spans one calendar month up to now.
- When opening an alarm’s history from the navigation bar, the period sets to one week up to now.
Regardless, the time period can be adjusted with the datetime picker while viewing the history.
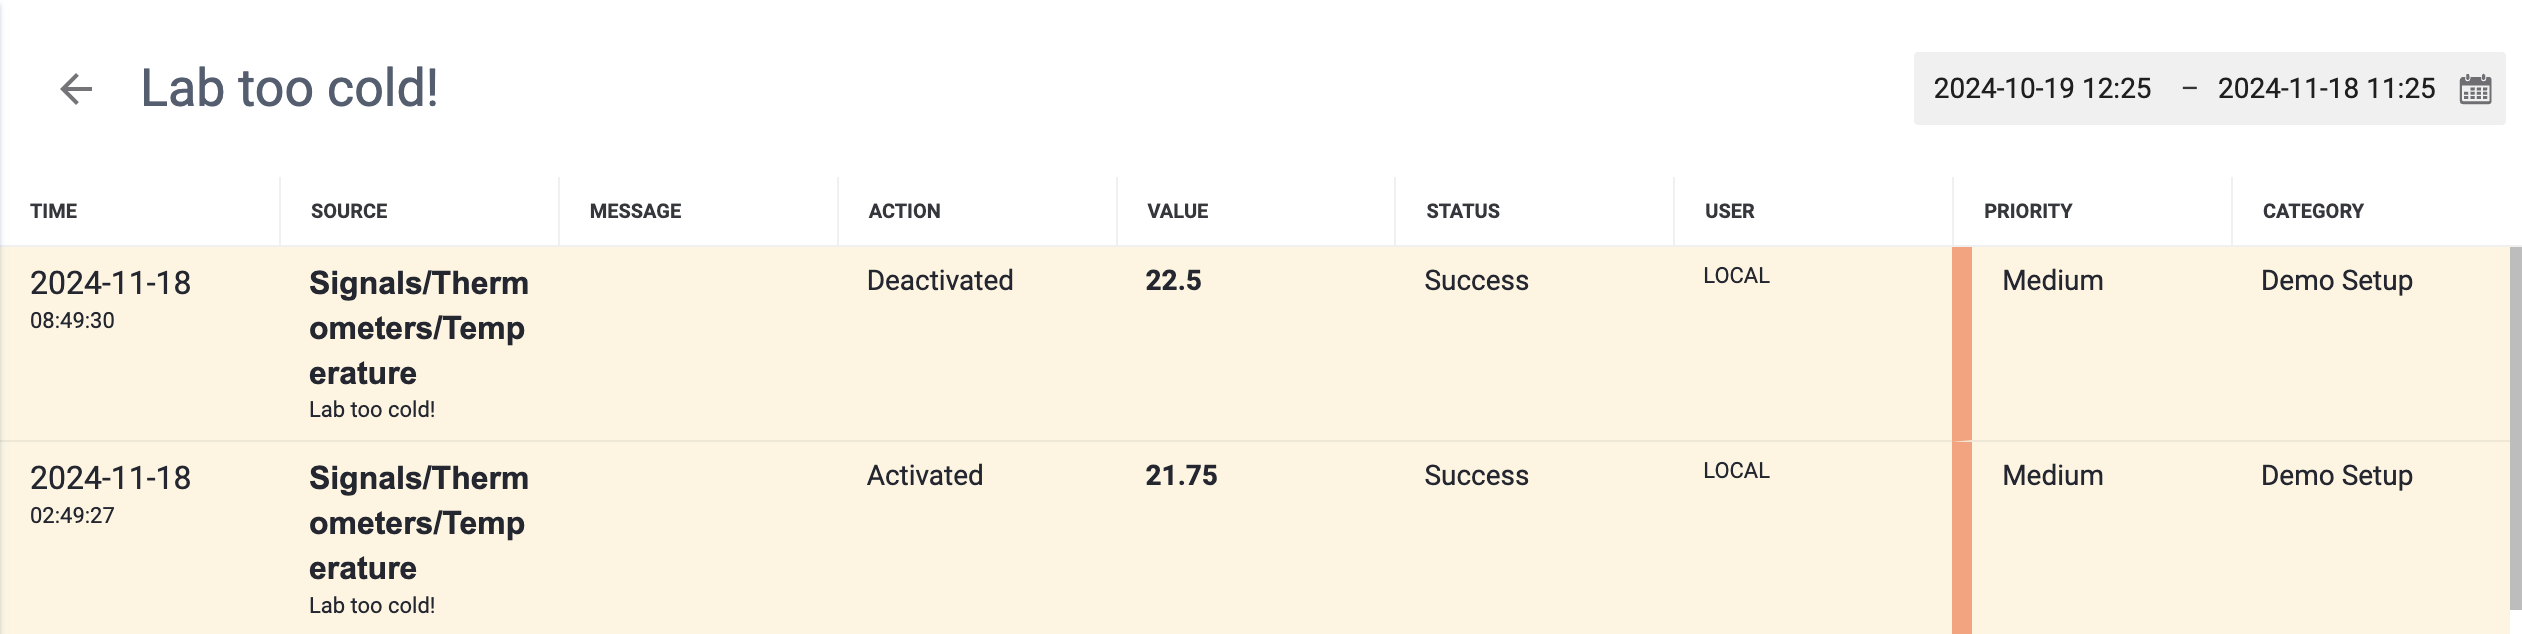
Fig. 13. Even a subtle change in value, by as little as 0.75 ºC, can change the state of an alarm.
Click on ← to return to the main view.
Further reading
- Check Logs presents a brief overview of other activity logging tools.
- Statistics can be viewed on the Portal in more detail.
Keep Me Posted!
The Cloud’s default way of signaling an alarm is flashing the colored counter in the header, both in the HMI and on the Portal. However, you might want to be alerted of an alarm as soon as it’s been activated. The Cloud has a solution in form of email notifications. You can opt in and out of email notifications at will. Here’s how you do it:
- Navigate to the Portal. On the Portal, click on to open the Portal menu.
- Click on your username at the bottom of the menu to open the Personal Cloud Profile.
- Once there, switch to .
- You'll see the list of projects you have access to, one per row. Proceed to configure the parameters:
-
Choose the desired priority level. You will not receive notifications on lower-priority alarms. -
Choose whether you want the email notifications to be in plain (Text) or rich text (HTML). -
Click on to open the list of categories you have permission to see. Check the categories you want to be notified of, then press to apply changes and close the list. -
Finally, check this box to opt in for email notifications or uncheck it to opt out.
-
- Once done, click on in the toolbar atop to save the changes in your user profile. From now on, you'll start or stop receiving notifications according to your settings.
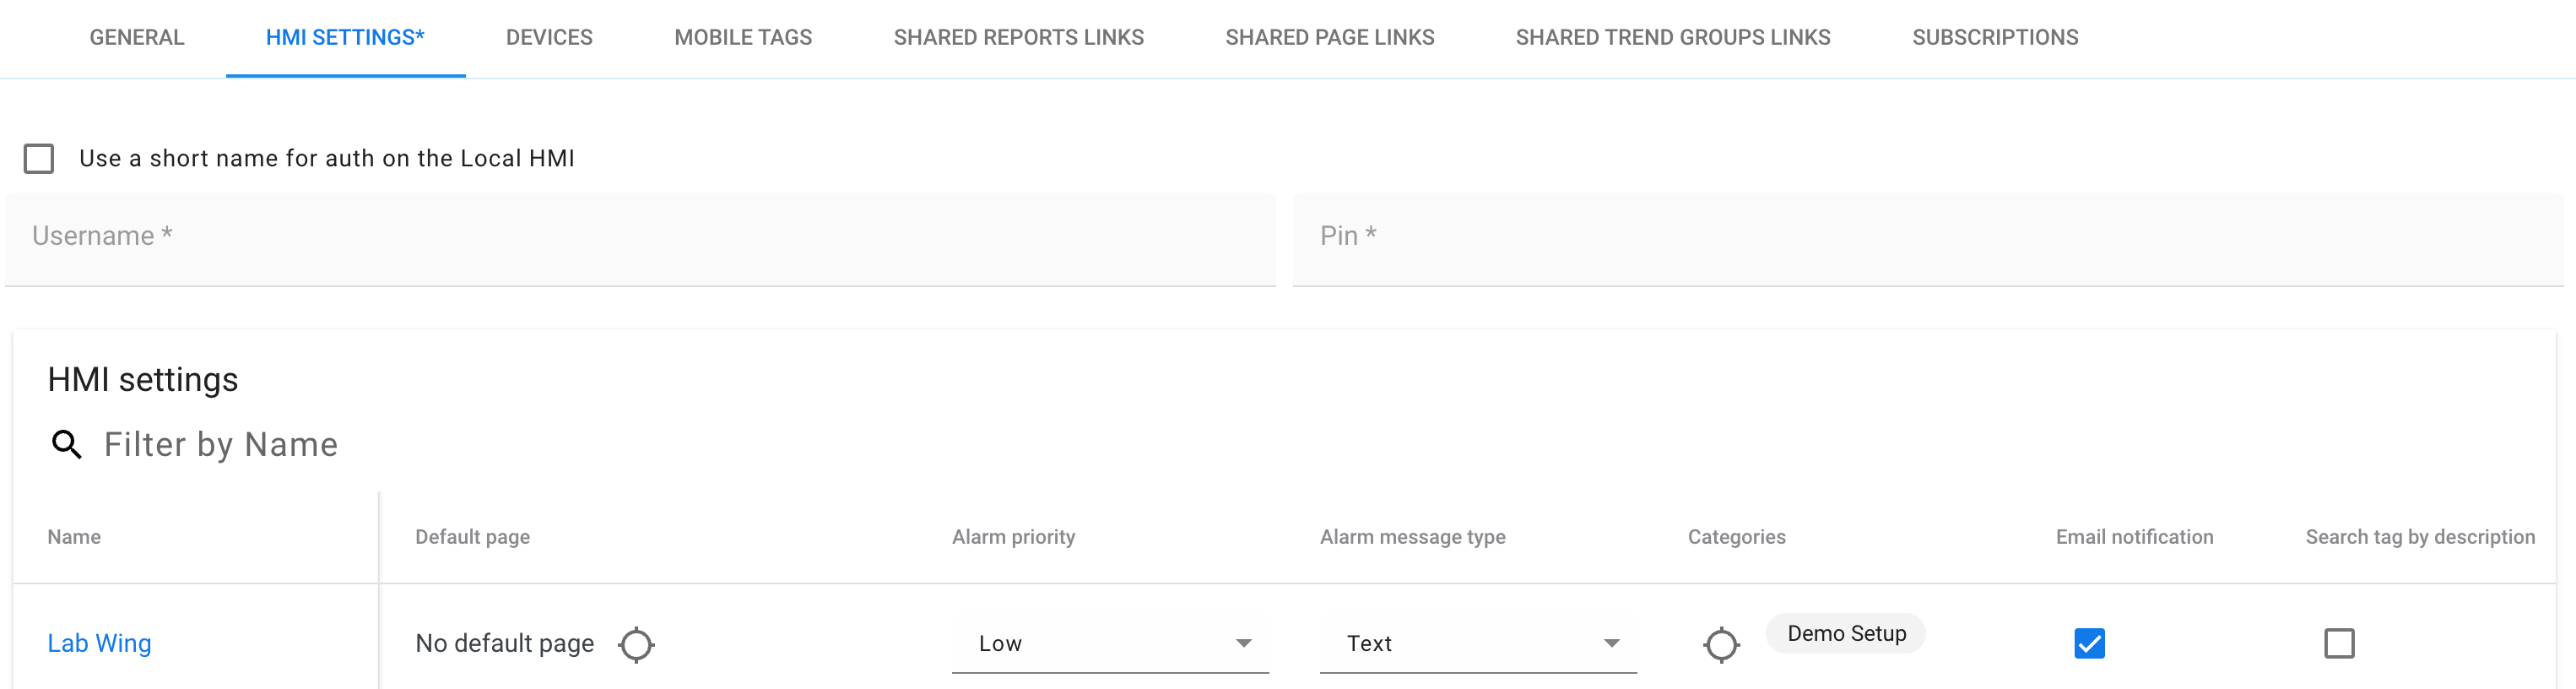
Fig. 14. This is how you get notified of all Demo Setup alarms under project Lab Wing.
BY THE WAY…
… your Personal Cloud Profile contains a lot of other useful settings — check them out!
These are tag names; labels on the page itself are slightly different. ↩