Work With Pages
This is an introductory guide; for a complete manual on this interface, see HMIADVANCED
This link leads to a manual written for advanced users. » PagesADVANCED
This link leads to a manual written for advanced users..
When working with a project in HMI, your starting point is a page. It might be the project’s default page or the one you’ve configured for yourself in your profileADVANCED
This link leads to a manual written for advanced users.. It is an interactive canvas that you or other users of the project have made for a variety of uses, including:
- Partial or complete display of your’ project’s design and layout, hardware parameters and status indicators, etc.
- Quick access to important hardware settings in the form of tags.
- Insight into what was going on with the project in the past.
This article will guide you though all these functions and explain when and how to use them.
Quick links
This article covers some of the tools available in the HMI’s page viewer. You might also be interested in PagesADVANCED
This link leads to a manual written for advanced users. and its daughter articles for a complete set of manuals about pages. Links to other relevant parts of this documentation can be found throughout the article.
Page Browsing
- Where
All pages you can access in the project are listed in the navigation beside the HMI menu. Pages are organized into folders, which can be expanded or collapsed. You can click on pages on the list to switch between them. Search is available, in case you are dealing with too many pages to locate one manually.
By default, a newly opened page is scaled to fit into the viewer. However, you can use your mousewheel to zoom in and out, and drag the page around with the left-click. This comes in handy when working on a large page that has many elements.

Alternatively, you can use the view controls in the upper right corner. and zoom in or out. , , , and move the viewport. You can also click on to center the viewport and/or reset the page to the default scale.
We’ll be using our Demo setup, which has only one page, aptly named for what it represents:
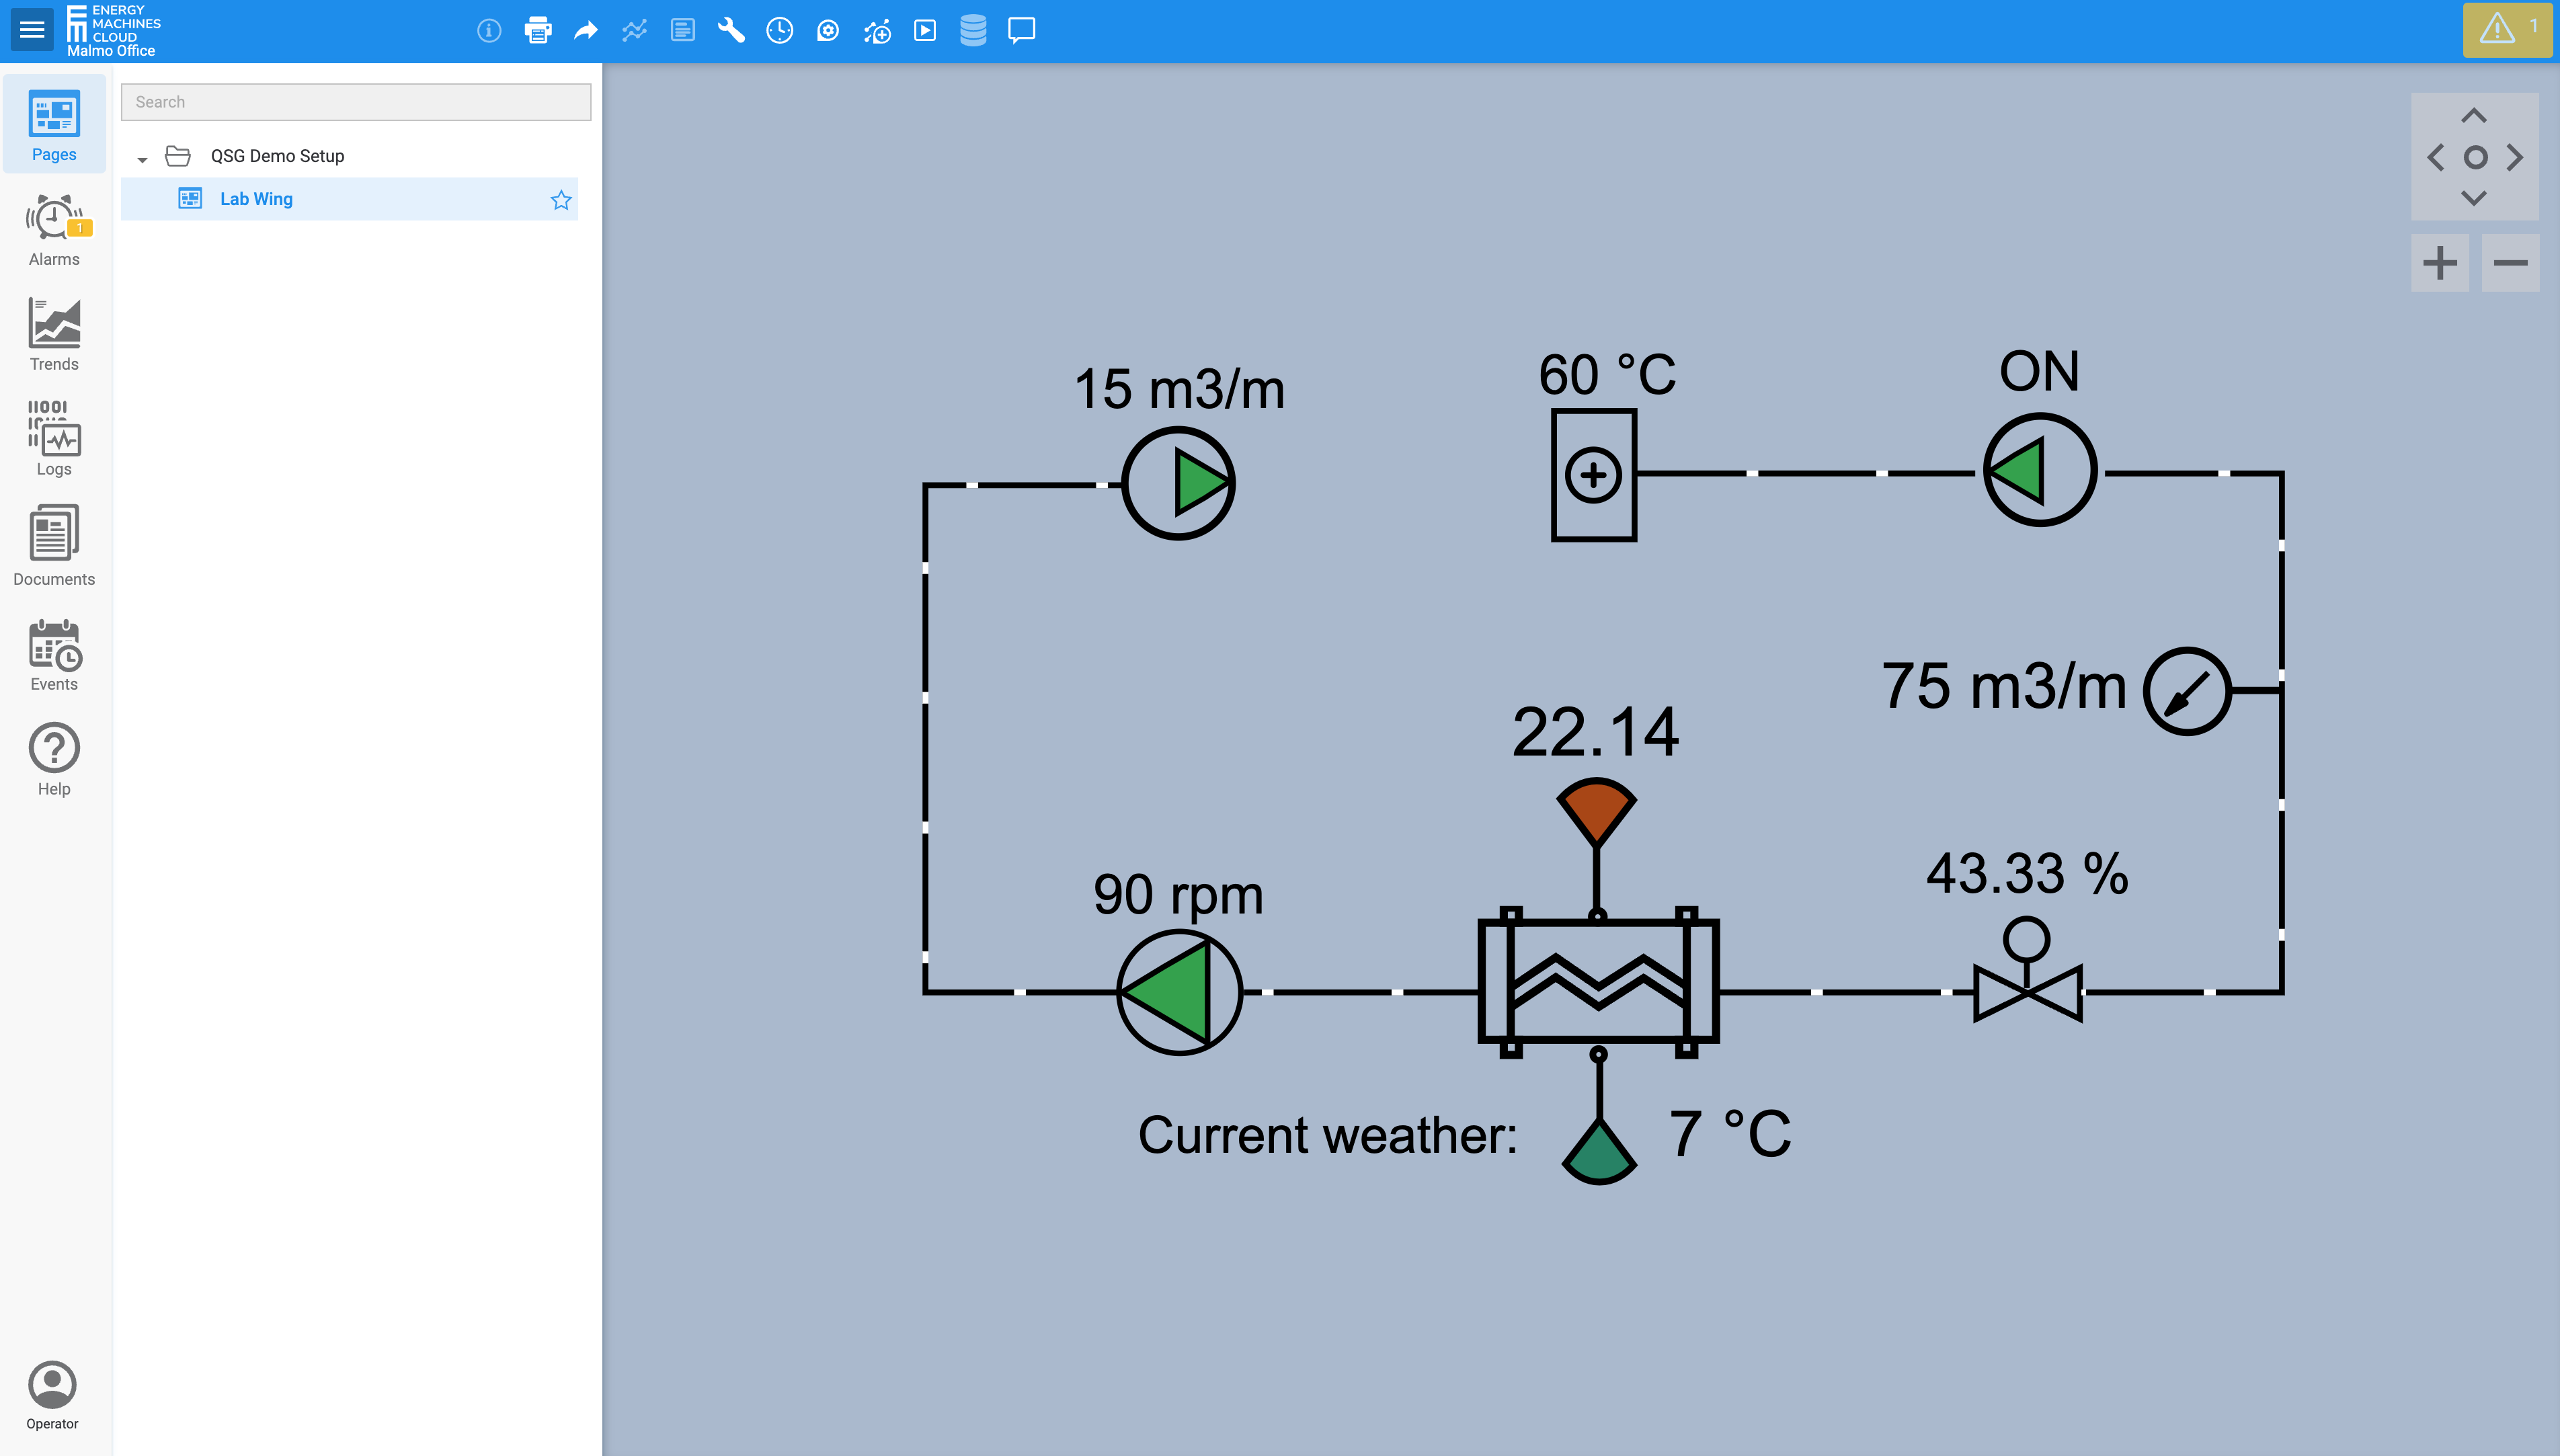
Fig. 1. This simple interface packs plethora of tools!
Comment on pages
In case you need to let others know something, HMI has a tool for page-wide commenting:
- Where
- » Header toolbar »

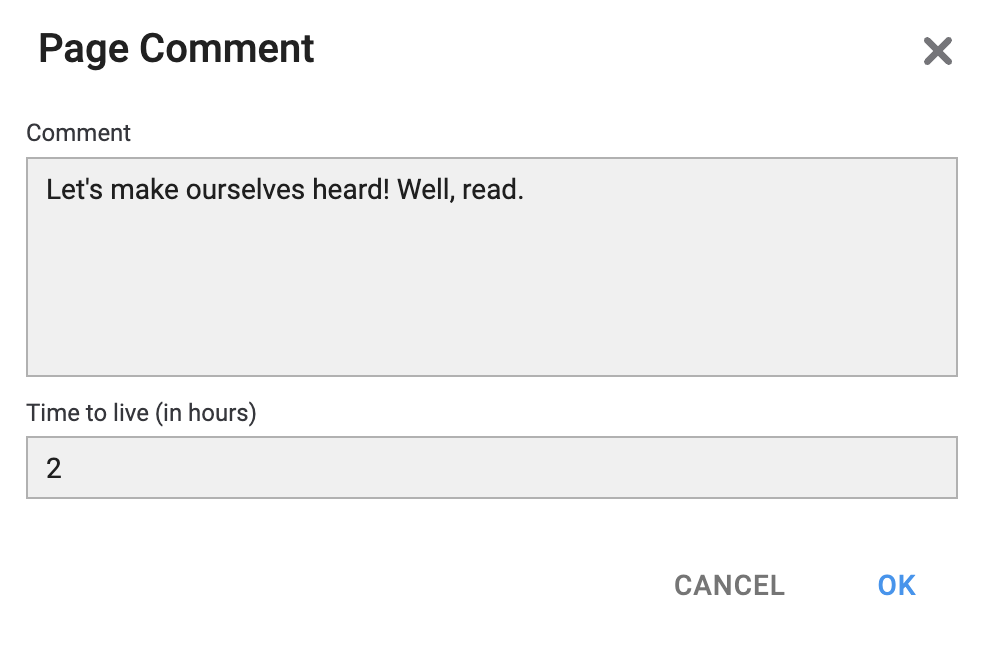
Such comments are visible to other users together with your username and timestamp. Only plain text is accepted. You can also specify , after which the comment will expire and delete itself (leave empty to make the comment persist).
Once you’ve added a comment, the toolbar icon will change to , and you’ll be able to click on it and see the comment you’ve made.
 |
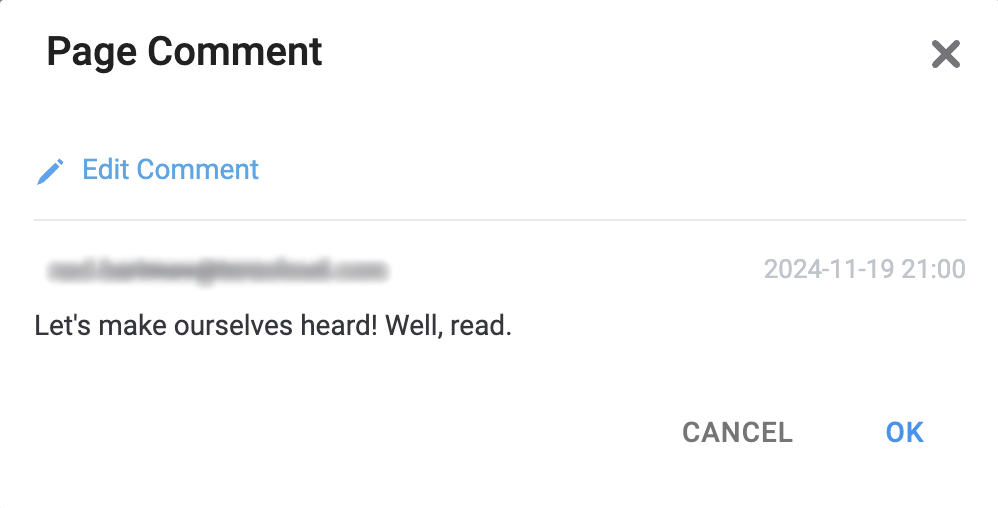 |
Fig. 2. We've just added a comment that will self-delete in two hours.
Once a comment is up, it can be edited with the option. However, it cannot be deleted until it expires.Page Objects
Any HMI page, being essentially a canvas, may feature a variety of objects arranged on a grid to represent schematically your HVAC system or part(s) of it.
- Page object
- Graphical element representing an HVAC component, with configurable visuals based on the values associated with the component.
Page objects are essentially pictograms, each of which has a particular set of features optimized for the pictogram-represented type of component. That can be:
- a valve;
- a sensor;
- a pump, etc.
Demo setup has several different object types so you check it out there to see what their pictograms look like.
When working with a page in HMI, objects provide two primary interactions:
State indication
While there are many different states that can be visually rendered by page objects, for the purposes of this guide we’ll cover three boolean states that you are most likely encounter in daily usage:
- On/Off
- Manual/Auto
- Alarm
In some cases, a device represented by one of your tags may be switched to manual mode. In this case, the device’s automatic controls are disabled. The device will therefore no longer adjust its output to maintain the provided setpoint(s).
A common industrial practice is to configure two booleanADVANCED
This link leads to a manual written for advanced users. tags to control devices:
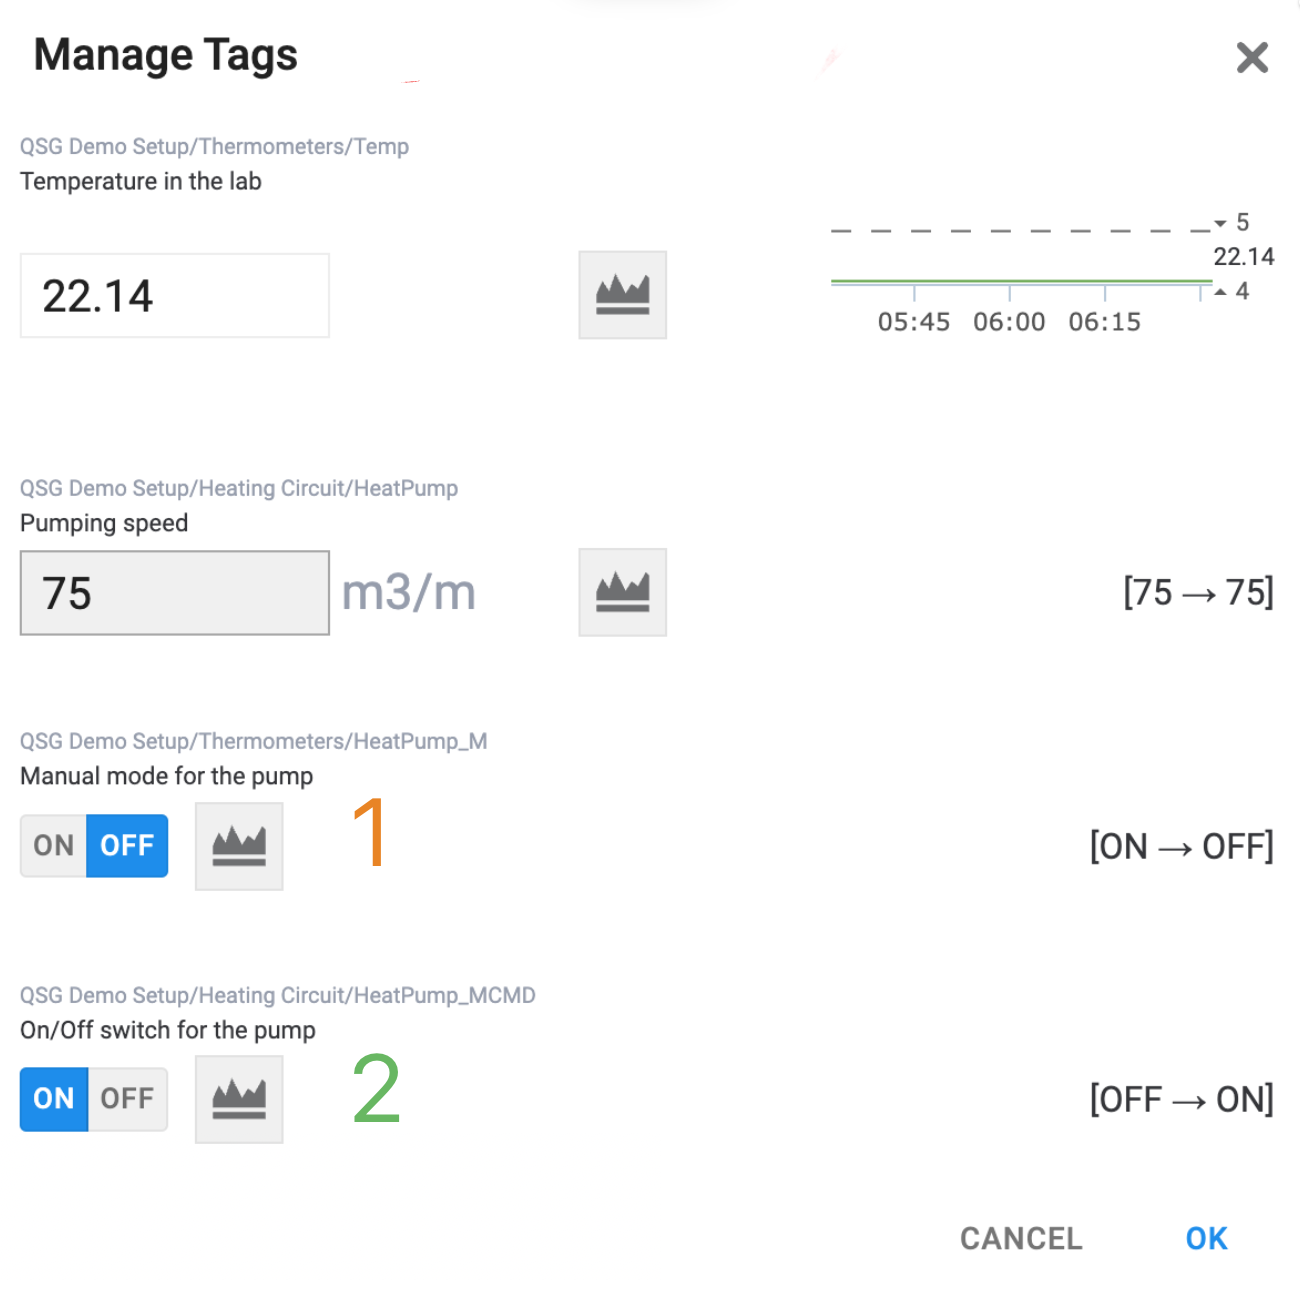
Fig. 3. Control tags are highlighted.
The following naming conventions apply:
- A tag suffixed with
_Mcontrols its associated device's manual mode; if set toON, the device is in the manual mode. - A tag suffixed with
_MCMDcontrols its associated device's operation when in manual mode. If set toON, the device is running.
HMI indicates these states using a yellow outline for the manual mode and the green fill for a running device:
| Object | Explanation |
|---|---|
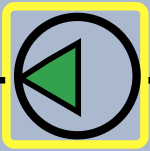 |
With yellow outline and green fill, the device is in manual mode and is running. |
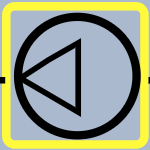 |
With yellow outline and no fill, the device is in manual mode and is idle. |
 |
With a green fill and no outline, the device is running in auto mode. |
 |
With no fill and no outline, the device is in auto mode and is idle. |
The next subsection and Tag Management describe how you can access the shown above, to toggle switches and what not.
Beside tags, an object can be associated with an alarm to indicate its status:
 |
Blinking red outline (to the left) means this alarm is active. If someone acknowledges it, it will stop blinking (to the right). For more information about alarms and their indicators, see How Do I Know an Alarm? | 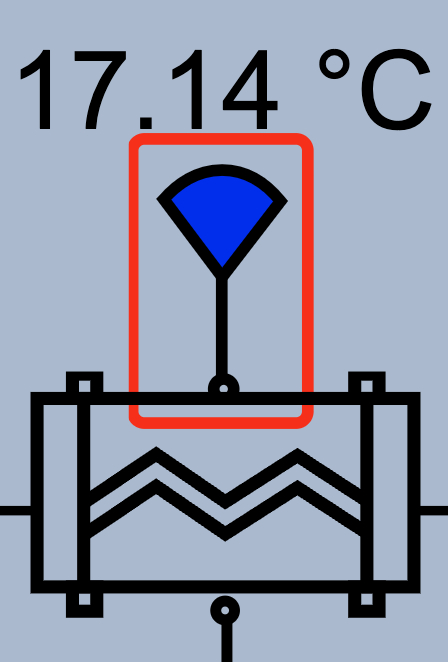 |
Tag access
As shown previously, a page object represents a component, and various properties of an object can be configured to visualize the values of the tags associated with said component. However, that is not the only way that a tag or several tags could be tied to a page object.
If configured with a click eventADVANCED
This link leads to a manual written for advanced users., the object becomes clickable in HMI, becoming a shortcut to the tag management dialog for this object’s tag set:
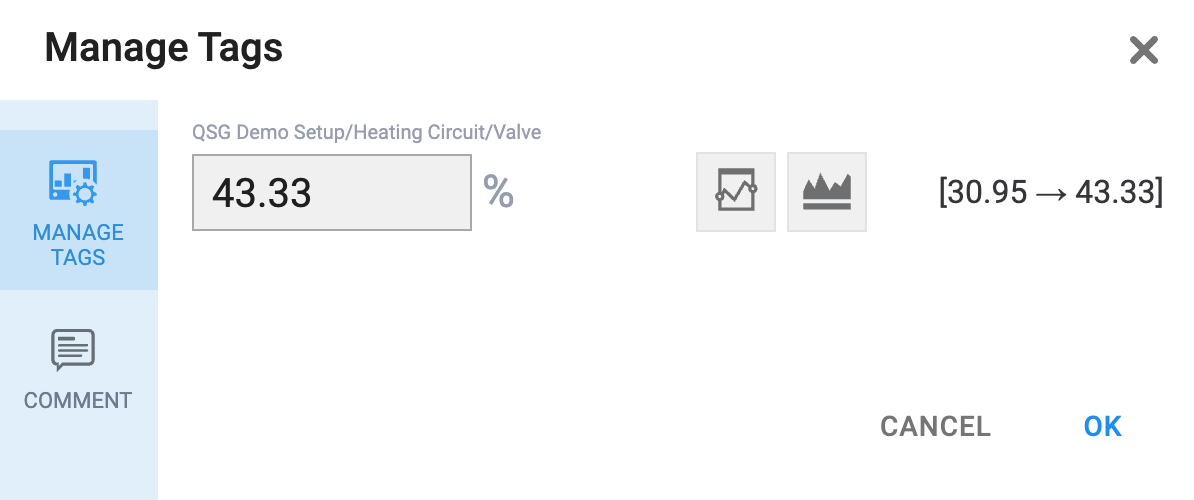
Fig. 4. Objects can serve as shortcuts to the dialog.
The dialog consists of two parts:
- is covered in the next section.
- allows you to add comments that then become visible to other users
 |
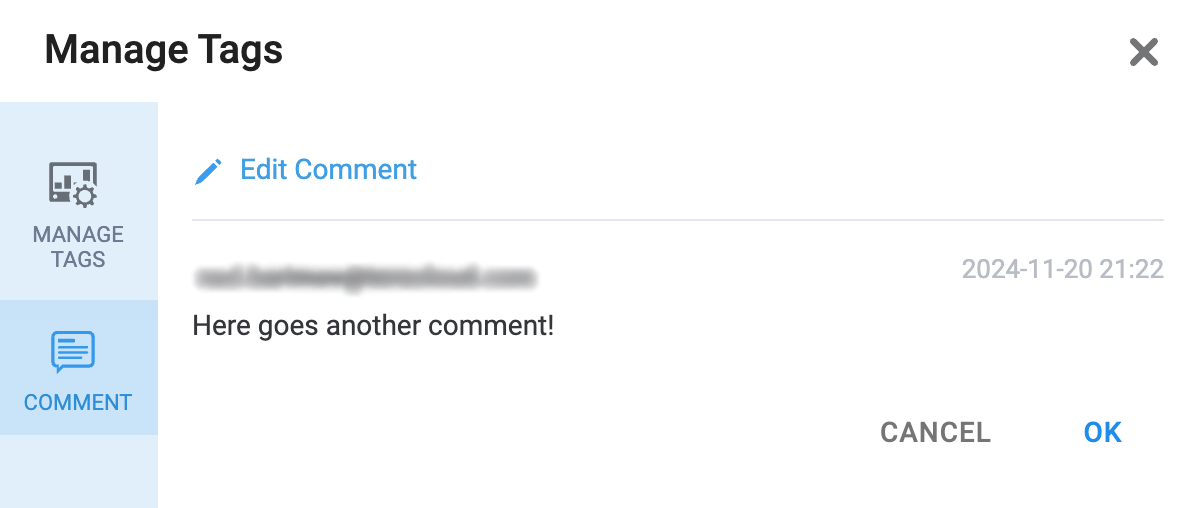 |
Fig. 5. This comment is for an object.
Object comments are otherwise managed the same way as page-wide comments; they can be later found in the dialog of any scope.
Tag Management
For a variety of reasons, you might want to send values to your devices. Each individual value receivable from or by the device is represented by a tag. Tags can be configured to be writable, in which case you will be able to change their values at will.
When written successfully, the tag’s value will update and trigger further associated changes, depending on how the project is set up and configured. If the page you’re looking at shows the tag’s value, the value will update immediately.
Changing a tag’s value requires operator-level accessADVANCED
This link leads to a manual written for advanced users. to the HMI.
If the write attempt fails, the tag’s value will not update; instead, you’ll see an error message:
Tag value not updated
This section further discusses two topics:
- dialog, which is the interface you use to write new values to tags, among other things.
- Where to find this dialog.
Manage Tags dialog
(MT) is a dialog that lists one or more tags, depending on how it was invoked (see the next section). It has the following elements:
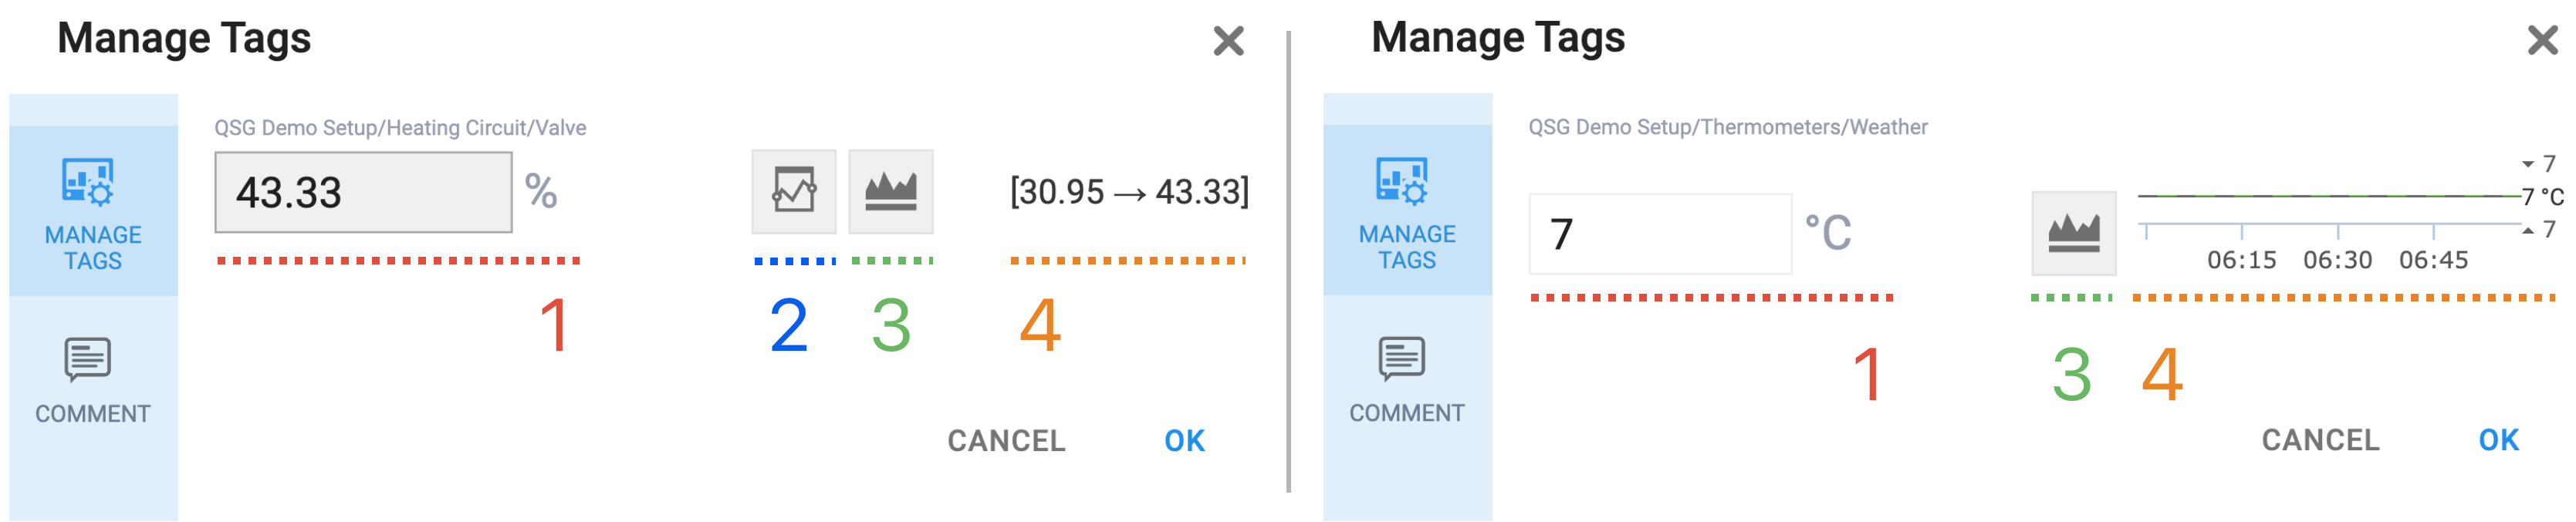
Fig. 6. Writable vs non-writable tag as seen in the dialog.
- Name of the tag and its value. If the tag is configured with a unitADVANCED
This link leads to a manual written for advanced users., th unit is also shown beside the value. - This is a shortcut to the Regulators associated with this tag.
- This is another shortcut: click on this button to go to and plot a graph for this particular tag; see Analyze Trends to learn more.
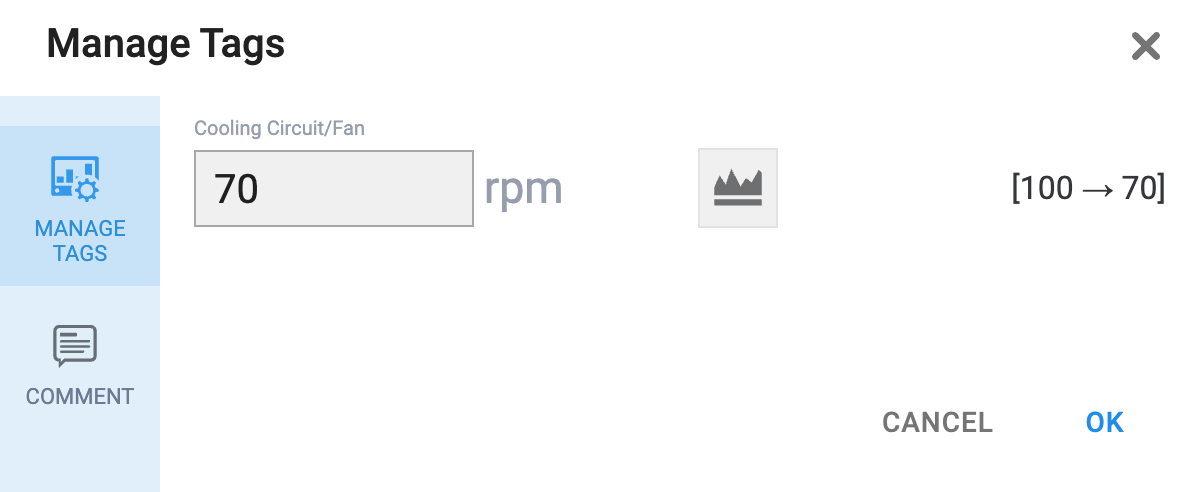
- Shows recent value change(s):
- the latest applied value change for writable tags only
- a miniature graph of the tag's value changes over the latest hour for non-writable tags only
To write new values, simply enter them in the value fields under the tags you want to overwrite:
 |
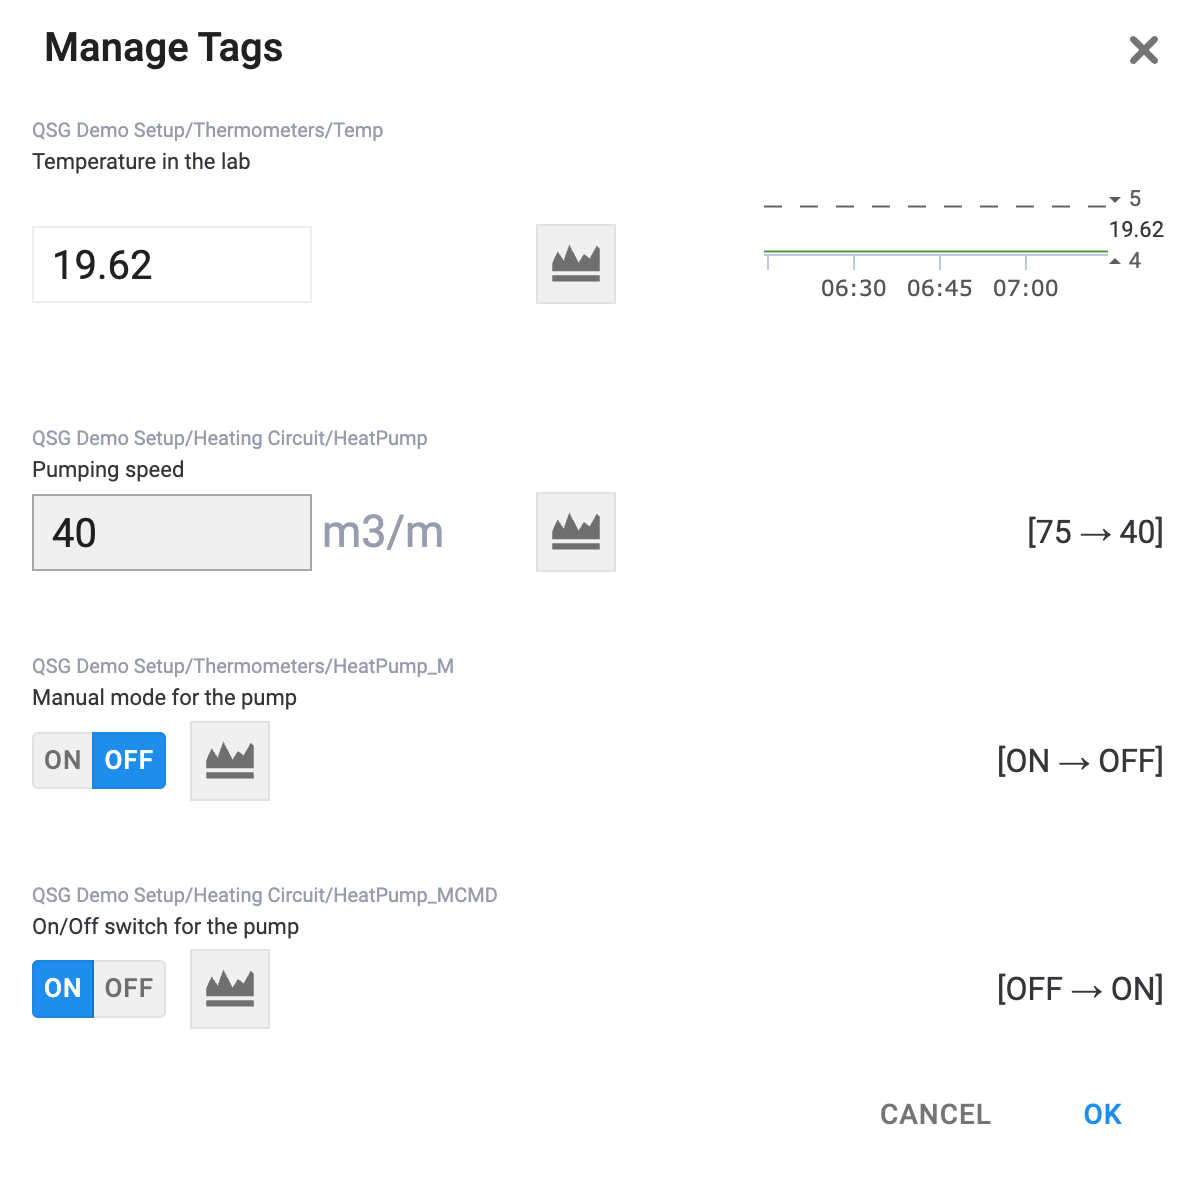 |
Fig. 7. Let's decrease the pumping speed down from 75 m3/m to 40 m3/m.
This will immediately update the tags’ values and cause the corresponding changes on the page. In our case, the temperature in the sample storage room changes drastically; see Demo setup to find out why.
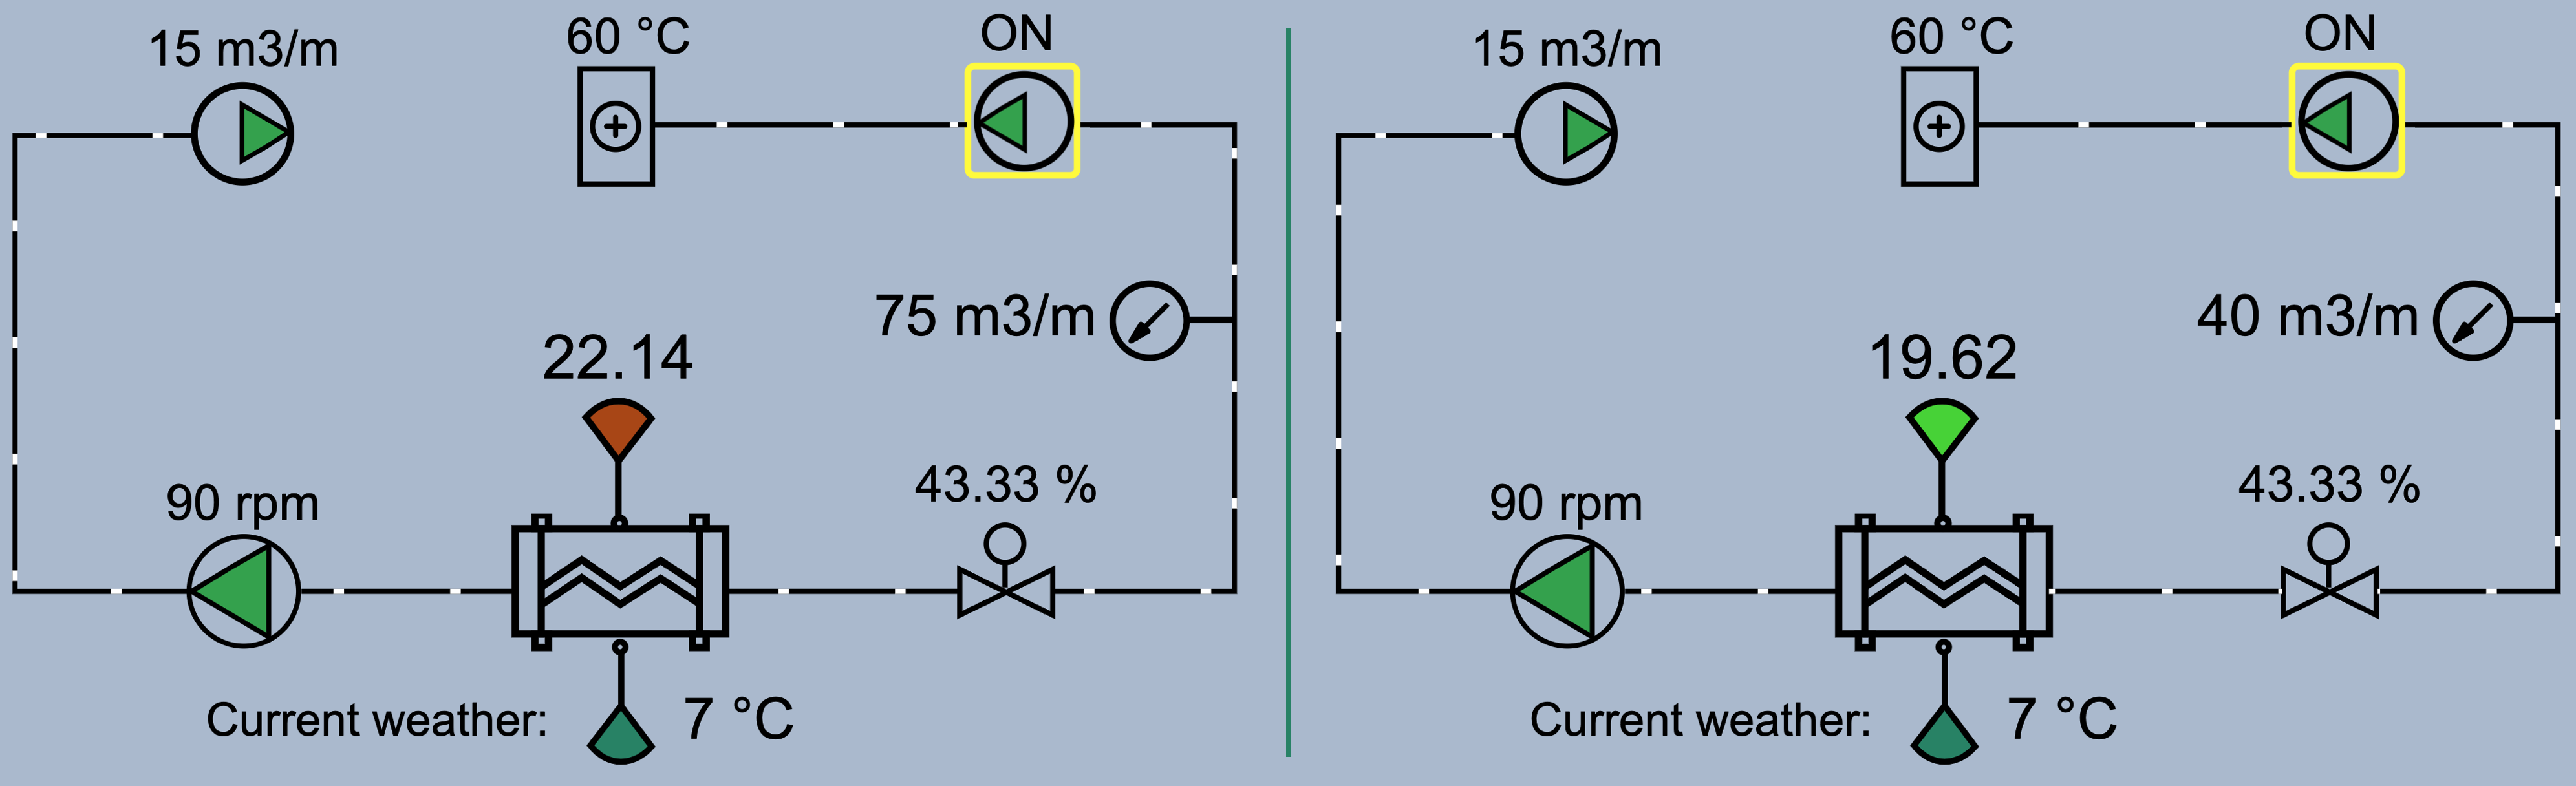
Fig. 8. Brrr! We made the lab cold!
Where to find it
There are three ways you can access the MT, which affects the scope:
-
If an object is configured with an appropriate click event, you can click on it to open the dialog for the tag(s) attached to said object. Fig. 6 shows two examples of a single-tag dialog opened with this method by clicking on page objects. -
This method lists all tags added to this page as managed tagsADVANCED
This link leads to a manual written for advanced users..- Where
- » Header toolbar »

-
The last method lists all tags configured for this project and provides basic search functionality, which you might want to use when working on a large-scale project.- Where
- » Header toolbar »

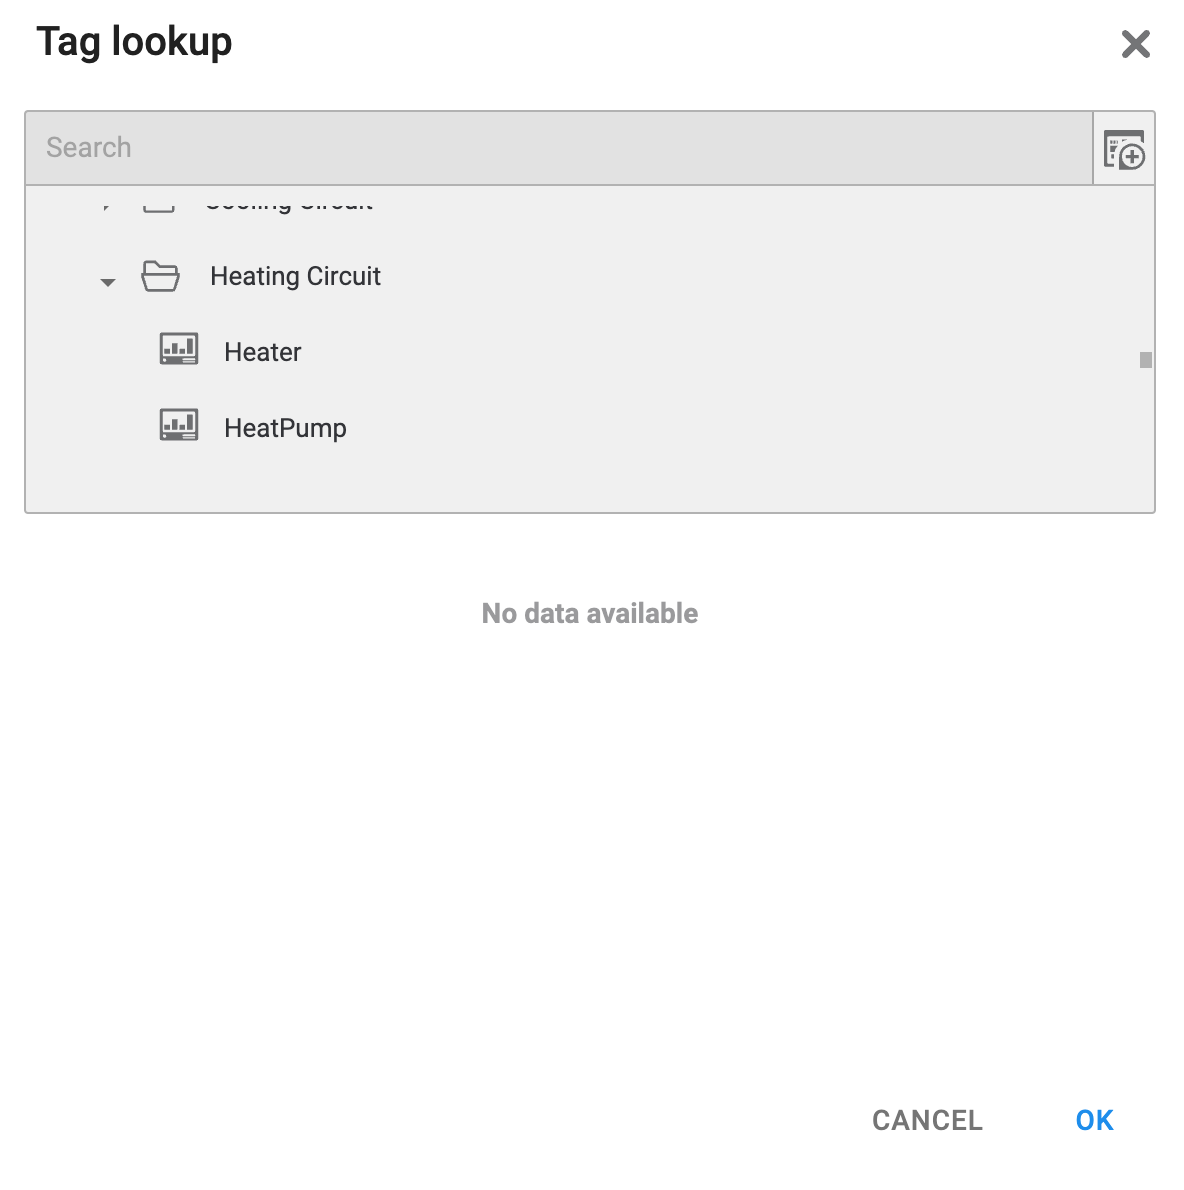
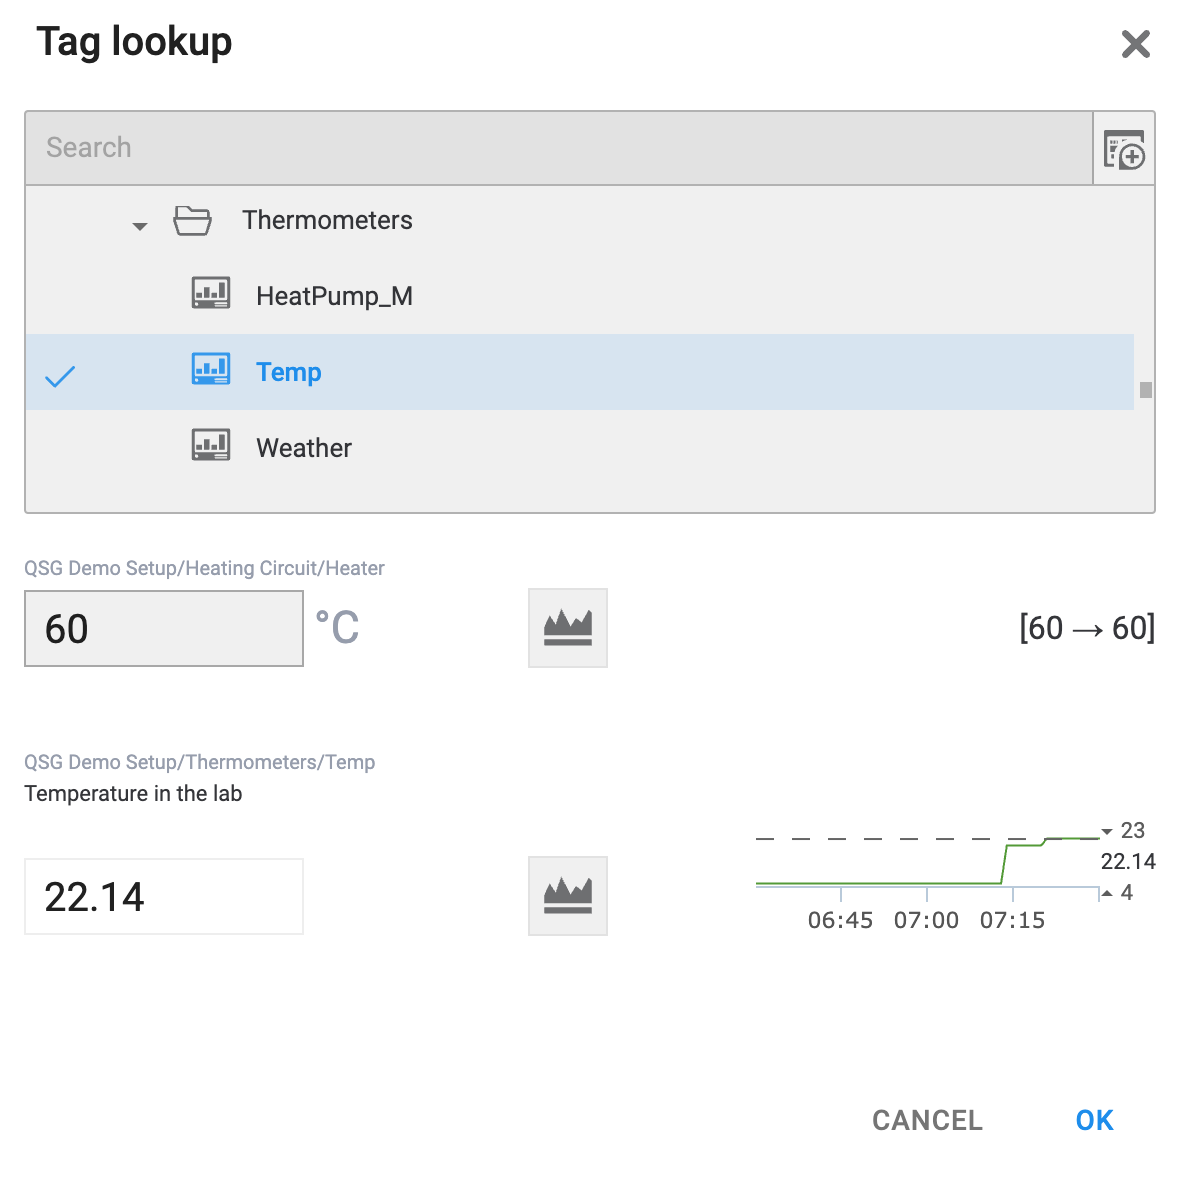
Fig. 9. Tag lookup: newly opened vs after selecting a couple of tags.
To sum it up:
- You can click on an object on the page to open the dialog for the attached tag.
- is a shortcut that immediately lists all tags attached to the page you're looking at as managed tags.
- provides the same value management tools but can access all tags in the project.
Further reading
Dropdown list is not the only way to find tags — you can also quickly add managed tags from other pages! Read about the Tag Selector to find out how.
Regulators
Previous section discusses how to manually write a new value to a tag in a variety of ways. But is there a way to automate the process?
In some cases, a tag’s value can be optimally predicted by some function of another tag’s value, the HMI has a special tool that can do just that:
- Regulator
- Special programmable tagADVANCED
This link leads to a manual written for advanced users. that continually adjusts one tag’s value by plotting it against another tag’s value on an 2D plane.
Regulator is essentially a 2D curve that traverses an arbitrary number of points $ {X, Y} $, where $X$ is the value of the monitored tag, $Y$ is the corresponding value of the controlled tag.
- Monitored tag
- (also referred to as the source tag) Tag whose value is continually monitored to derive the desirable value for the controlled tag.
- Controlled tag
- (also referred to as the target tag) Tag whose value is automatically overwritten by the regulator when the monitored tag’s value updates.
How it works
Consider the following scenario:
- A simple heating circuit conditions the indoor temperature of a room.
- The circuit’s most important parameter is the flow through a valve, determined by its degree of opening.
- When the outdoor temperature is low, the valve should be opened to a greater degree in order to boost the heat transfer rate.
- On the other hand, when the outdoor temperature goes up, the throughput must be decreased to adjust the indoor temperature for the changing weather conditions.
We can use this knowledge to create a curve like this:
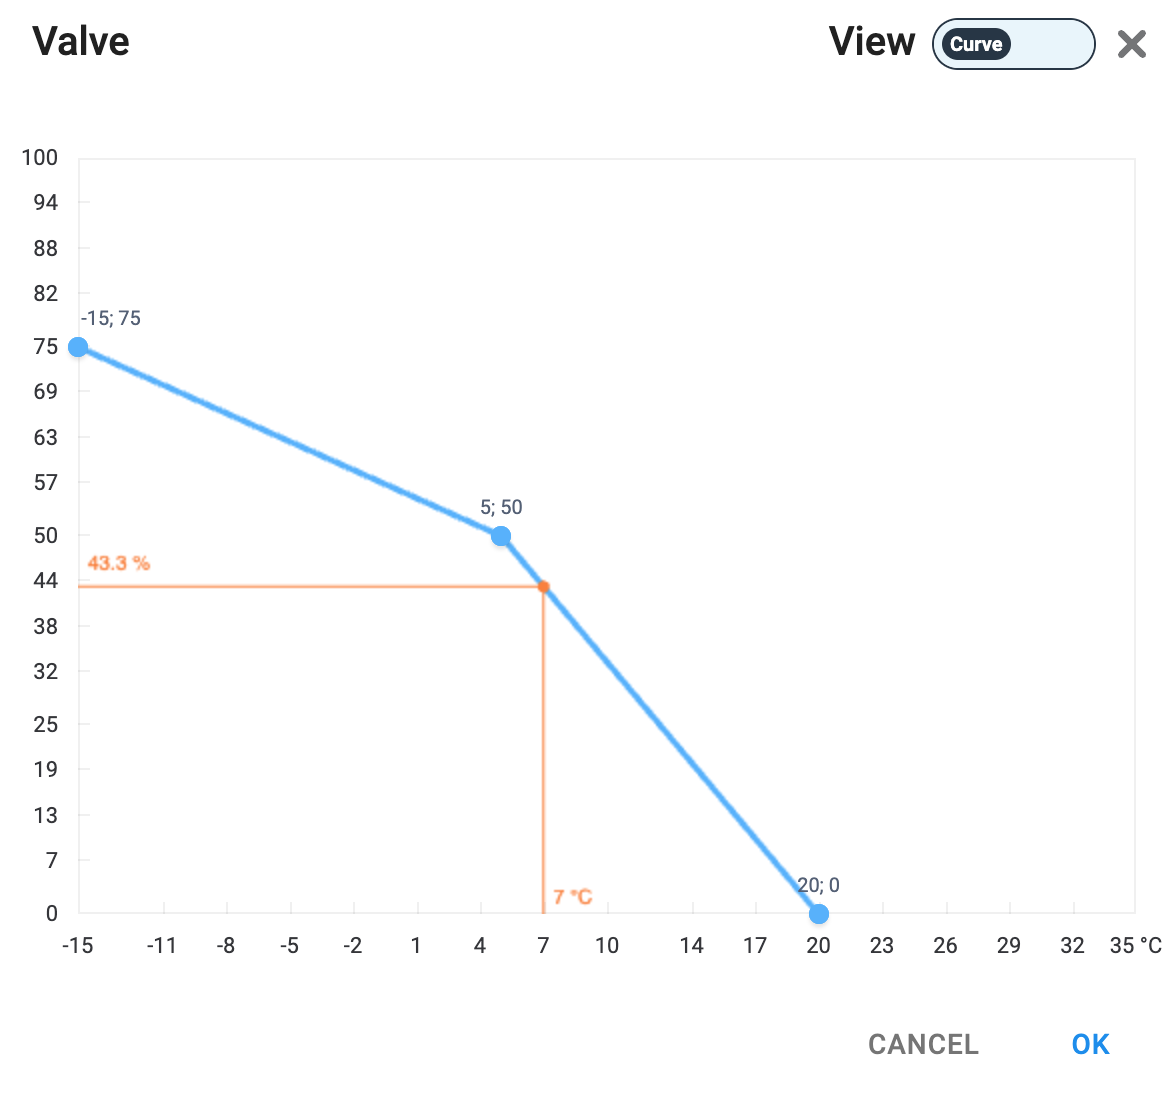
Fig. 10. 2D curve for tag Valve.
What we can see here is a set of three points: $-15, 75; 0, 50; 20, 0$. What does it mean? It means that:
- when the temperature outside is -15 ºC, the regulator will raise the valve opening degree to 75%;
- at 0 ºC, the valve will be half-closed;
- finally, as the temperature approaches +20 ºC, the valve closes completely.
What if the outdoor temperature is none of those values? Do not worry—the regulator are smart enough to compute any in-between points by following the curve. You can see it on the screenshot as well: the orange dot demonstrates the intersection of X = 7 and Y = 43.33, meaning that for the current weather is 7 ºC, the regulator opens the valve to 40%.
Further Reading
While it is advanced material, we still recommend reading the article about regulatorsADVANCED
This link leads to a manual written for advanced users. for a better understanding of the principles behind it.
Curve adjustment
It might become the case that you need to alter the curve. Just as the HMI allows you to write new values to tags, it can also let you edit the regulation parameters, namely the $X, Y$ coordinates of the control points.
Like any other tag, a regulator can be added to a page object as its click event. In this case, the regulator-controlled tag becomes the object’s managed tag. Such tags feature shortcuts to the regulator curve as shown in Fig. 6.
Regulators can only be accessed when attached to page objects.
Once you open the 2D plane, you can simply drag any of the points to change its coordinates, and the curve will update accordingly. When editing the curve, you’ll also be able to see immediately how $Y$ will update for the current $X$.
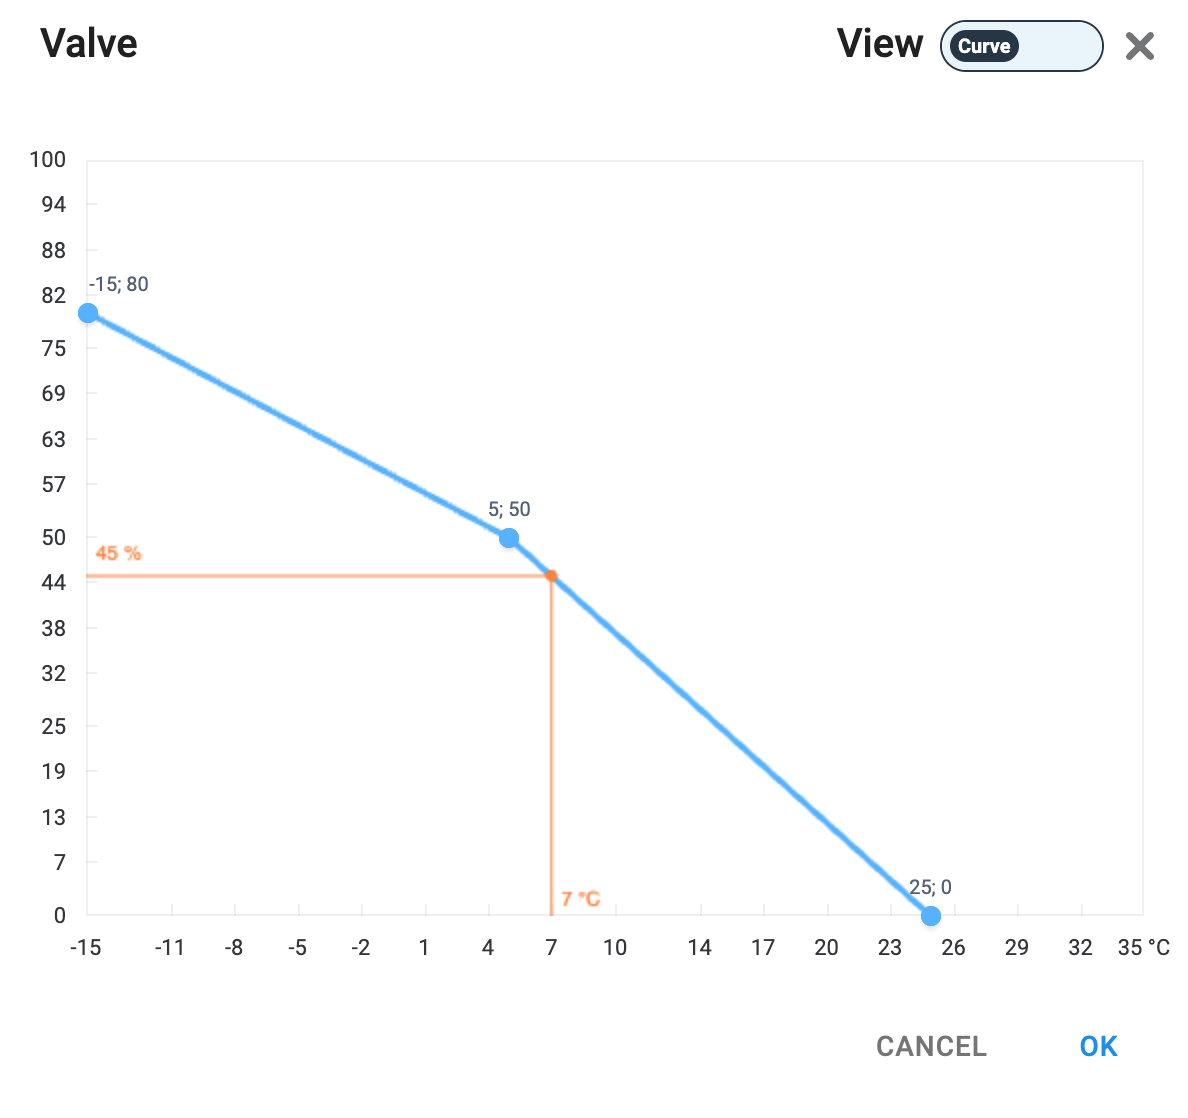
Fig. 11. New curve: now the low-point is $-15, 80$ and the high point is $25, 0$. This changes the current result at 7 ºC to 45%.
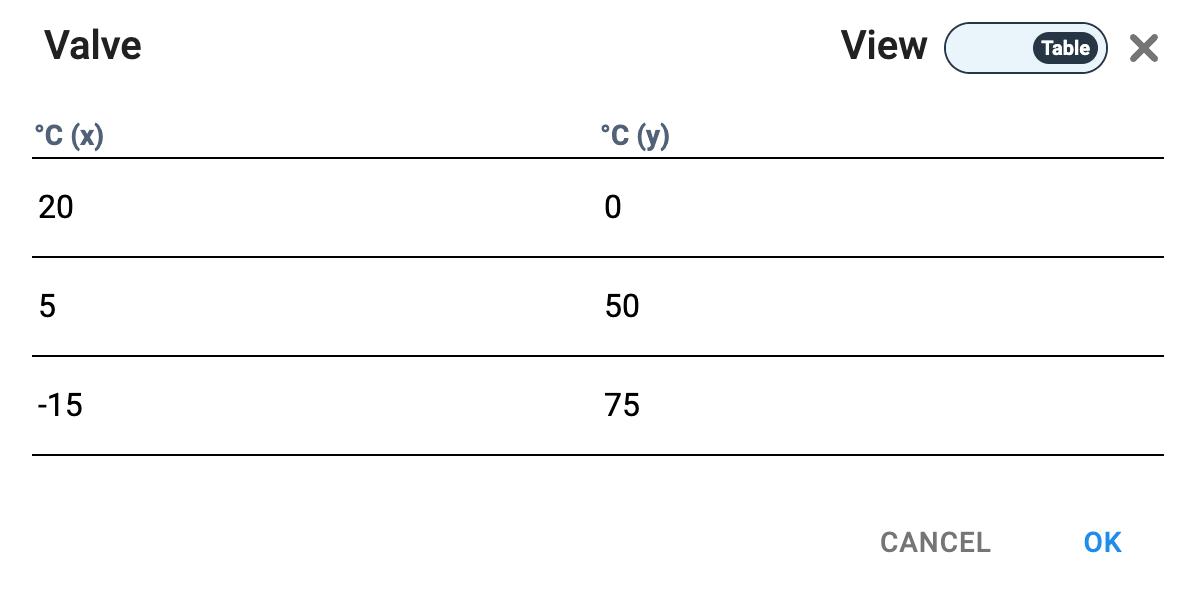
Alternatively, you can switch to the table mode using the slider above the graph and enter the desired coordinates directly:
 |
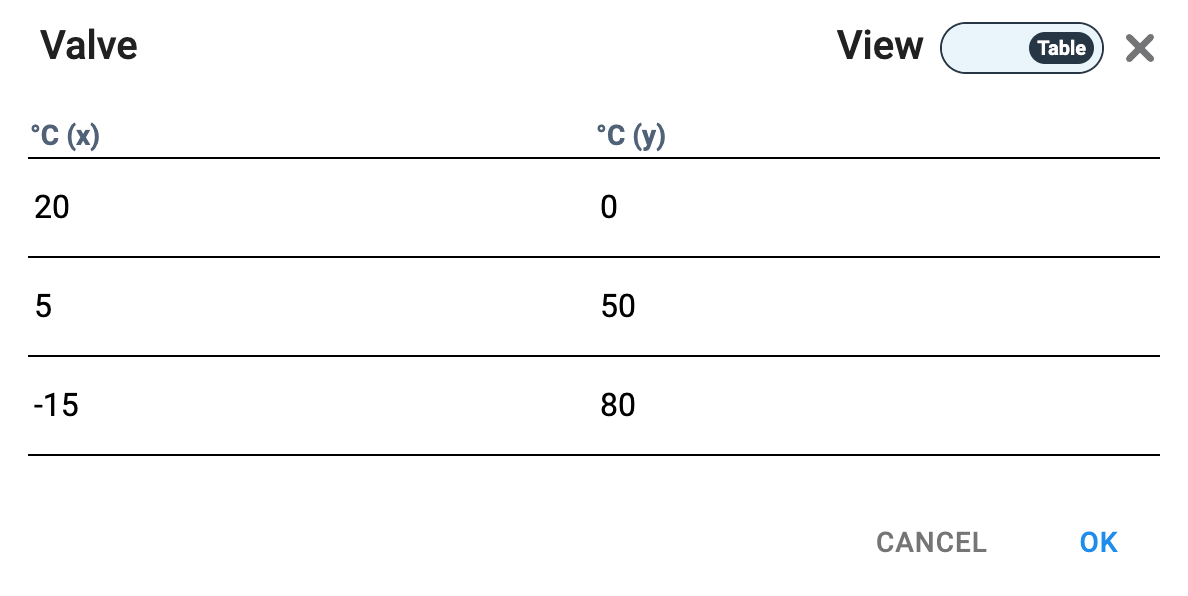 |
Fig. 12. Old and new values
Now you can save the curve or cancel the changes.
HMI allows you to change the coordinates of the points; however, the number of points can only be changed by editing the tag itself on the Portal.
Retrospective
Sometimes, you might want to know what happened with the project’s hardware at some point in the past. Luckily, the page viewer in HMI has a couple of neat tricks for just that purpose!
Rewind the history
- Where
- » Header toolbar »

This tool, when activated, switches the page viewer into history playback mode, which adds playback controls at the bottom of the interface:
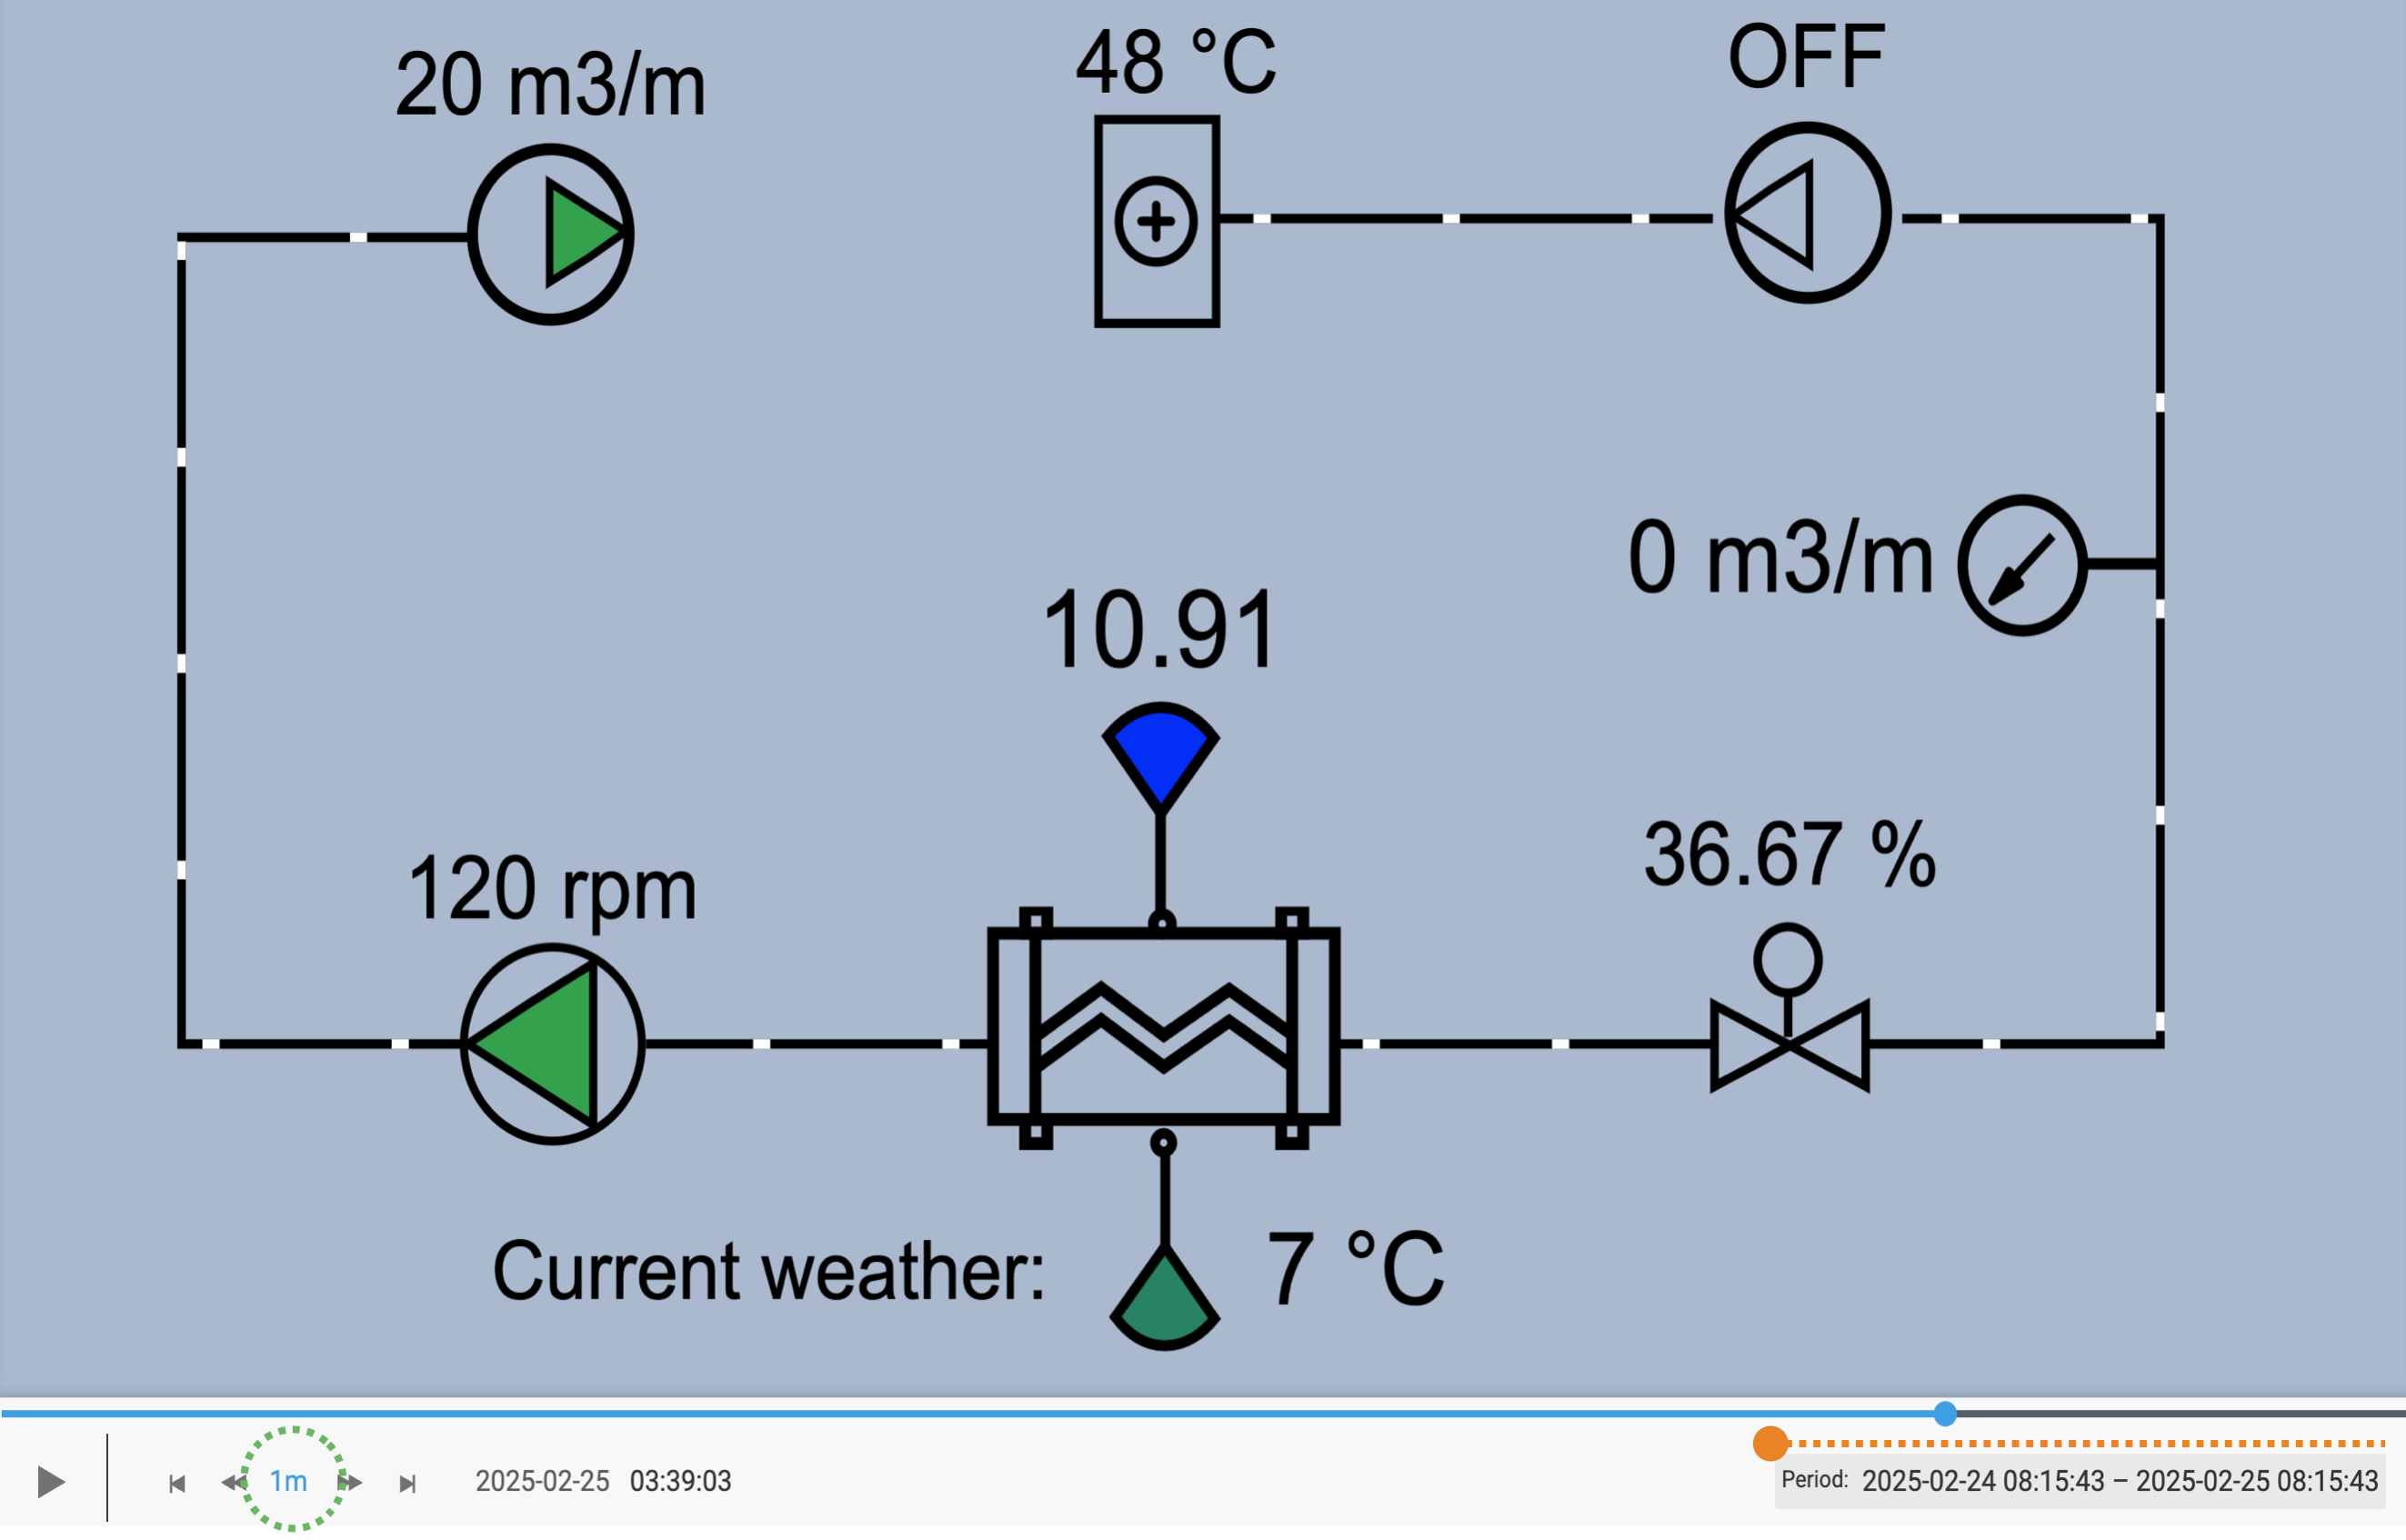
Fig. 13. A snapshot of the page as it looked some time ago.
Here, you want to configure two parameters:
-
Datetime picker; sets the replay duration as the period between two points in time. By default, the period is set to one week prior. -
Sets the speed of history playback; default is1m, corresponding to one minute.
Click on to start the playback. The following will happen:
- The selected period will be split into chunks equal in duration to the .
- The page will begin changing, showing what it was like in each such chunk.
- Each chunk will be shown for one second; tag values on the page will be averaged over each chunk individually.
You can use other playback controls to change the speed during playback, pause and resume, and jump between chunks. You can also click on the playback bar or drag the position marker to jump to a position. The current position is shown as the datetime beside the playback controls.
After you’re finished, click on to exit the history playback mode.
Make a trend
History playback is a great tool that enables you to reproduce the state of a page at some point in the past. However, you can only see momentarily captured tag values in it. If you want to see how values changed over time without scrubbing through the playback, or compare values from multiple tags on a timeline, you need another tool:
- Where
- » Header toolbar »

When active, this tool switches the page viewer into tag pickup mode, which highlights the tags attached to the objects on the page:
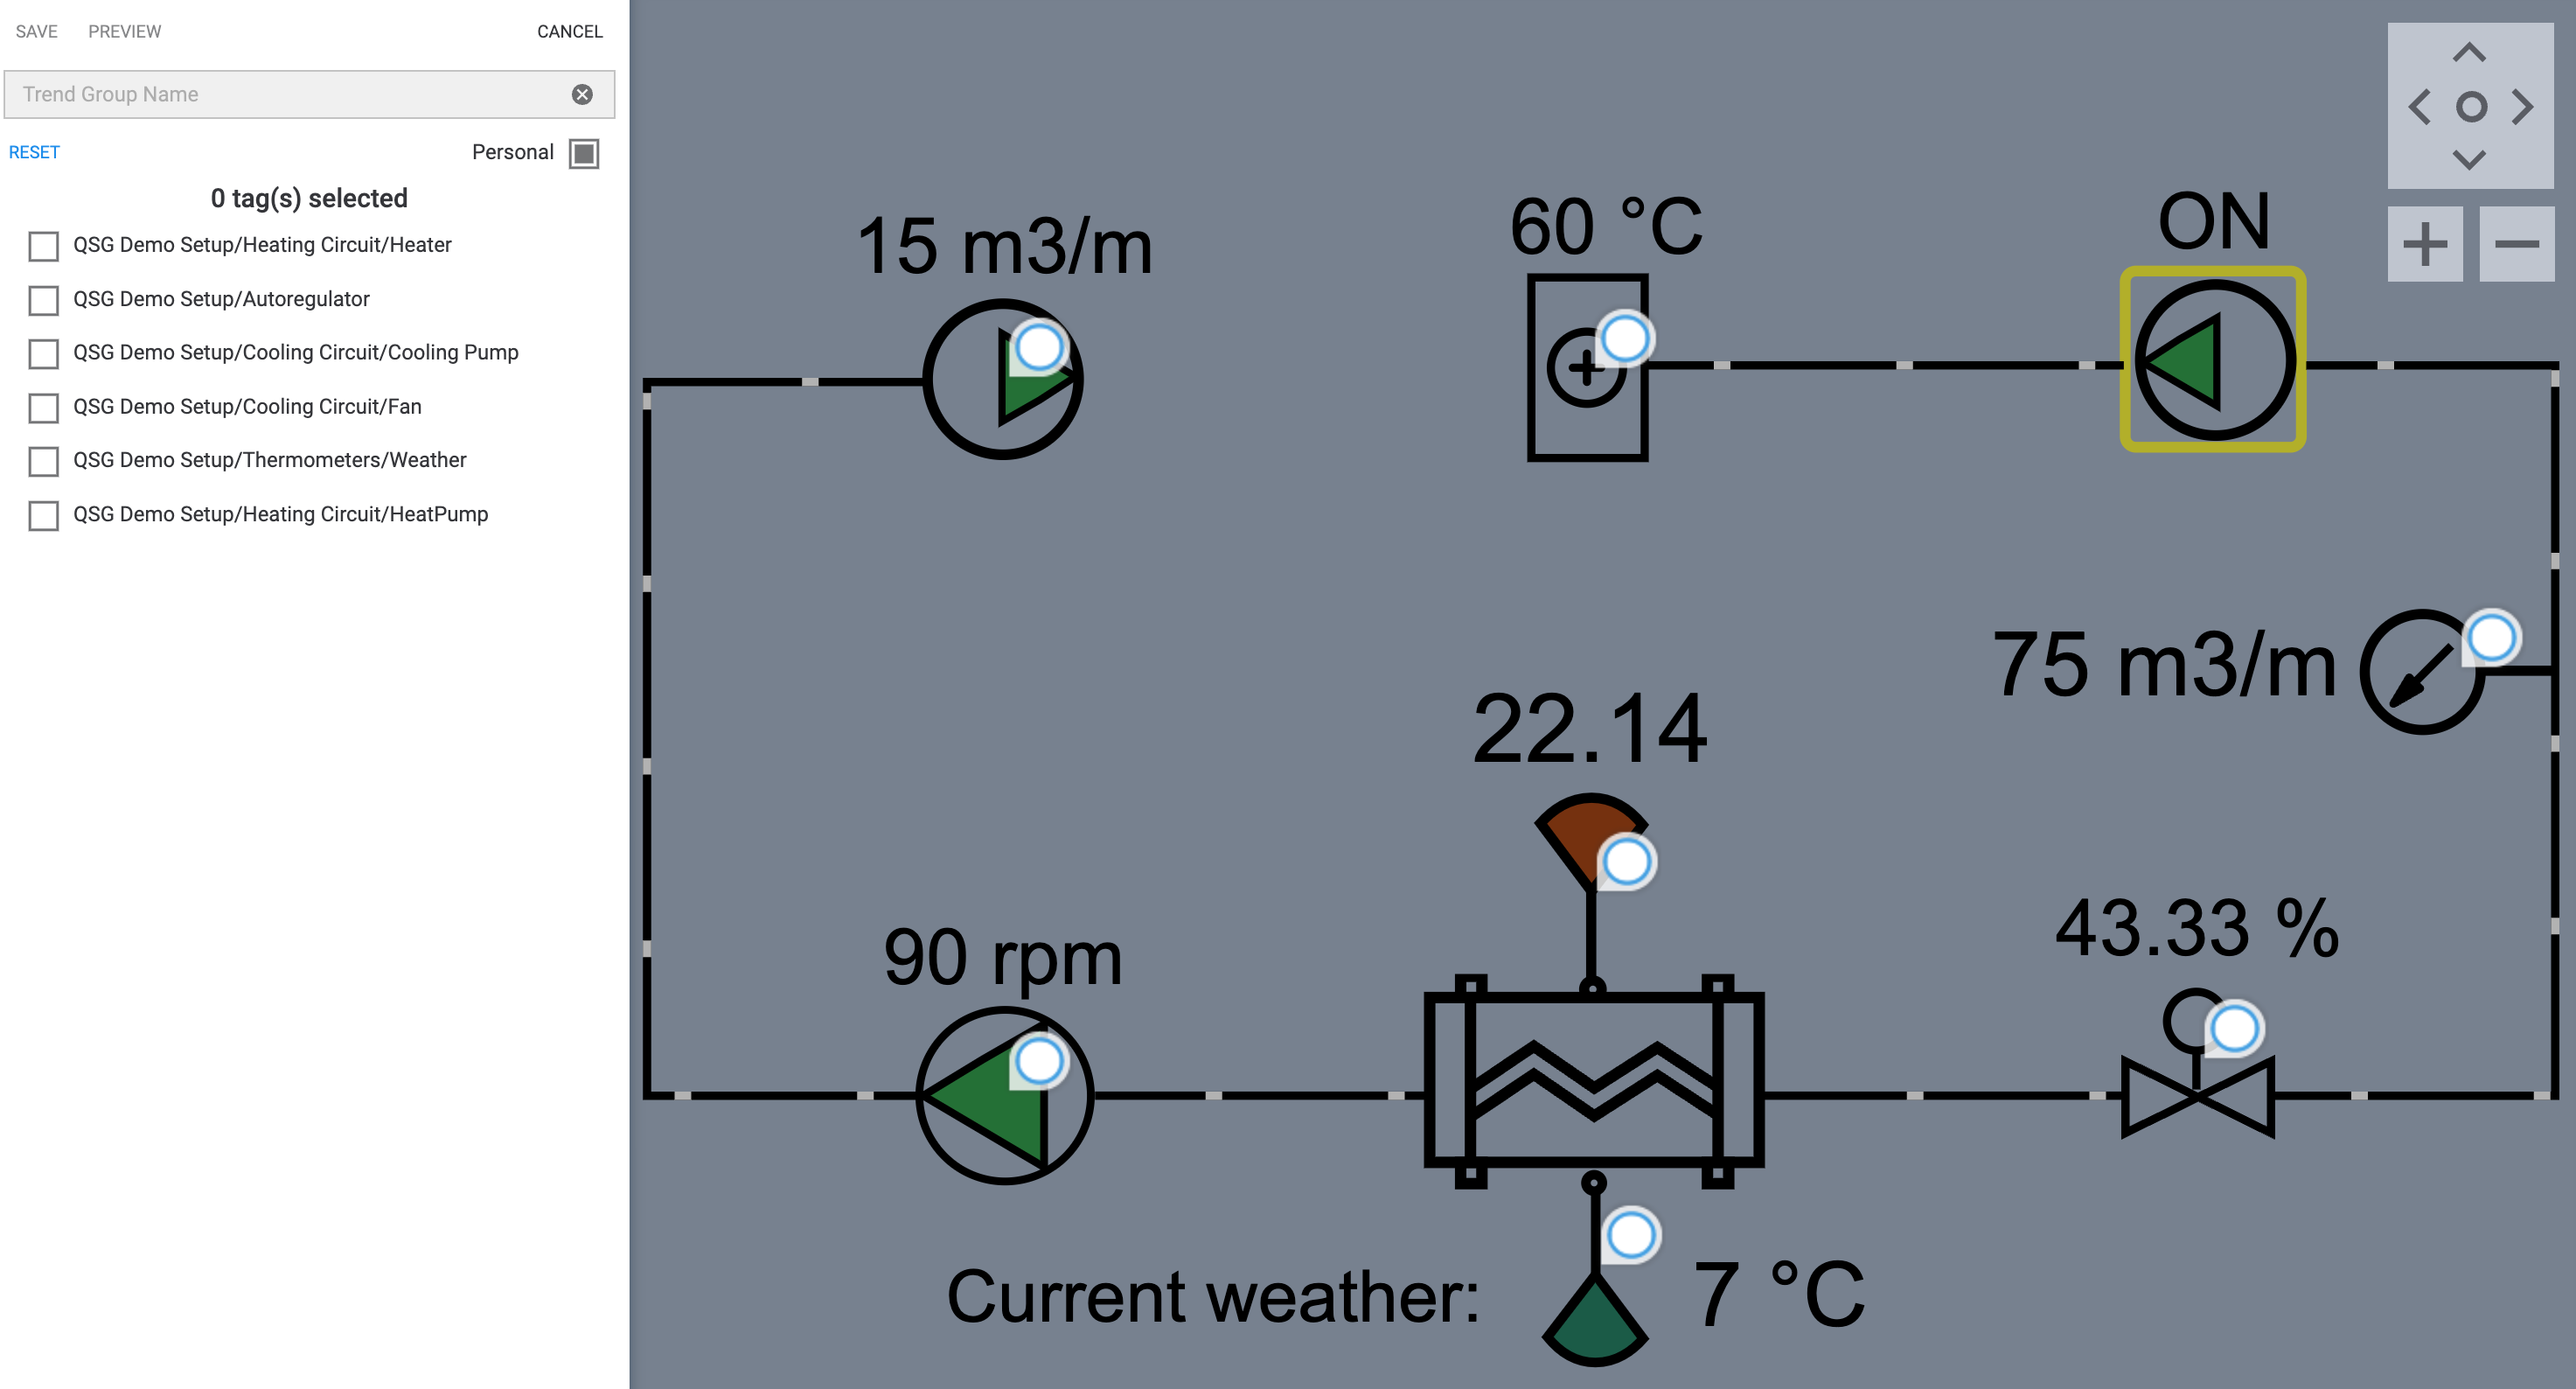
Fig. 14. These are the tags on the page.
Now you can select the tags you want to generate graphs for. You can check them on the page itself or on the list to the left. You also need to come up with a name for the newly created trend group.
Only tags linked with the parameter in the object’s Additional propertiesADVANCED
This link leads to a manual written for advanced users. are visible in this mode.
is another important setting here. If checked, you’ll create a private trend group for only yourself to see. If unchecked, the newly created group will be public, visible to everyone on the project via . Note that public groups cannot be made private after the fact.
Once you’ve selected the tag(s) you want to generate graphs for, you can click on and see what it is going to look like. From here, you can go to change your selection or to create this new group.
The viewer then will switch to and display your trend group!
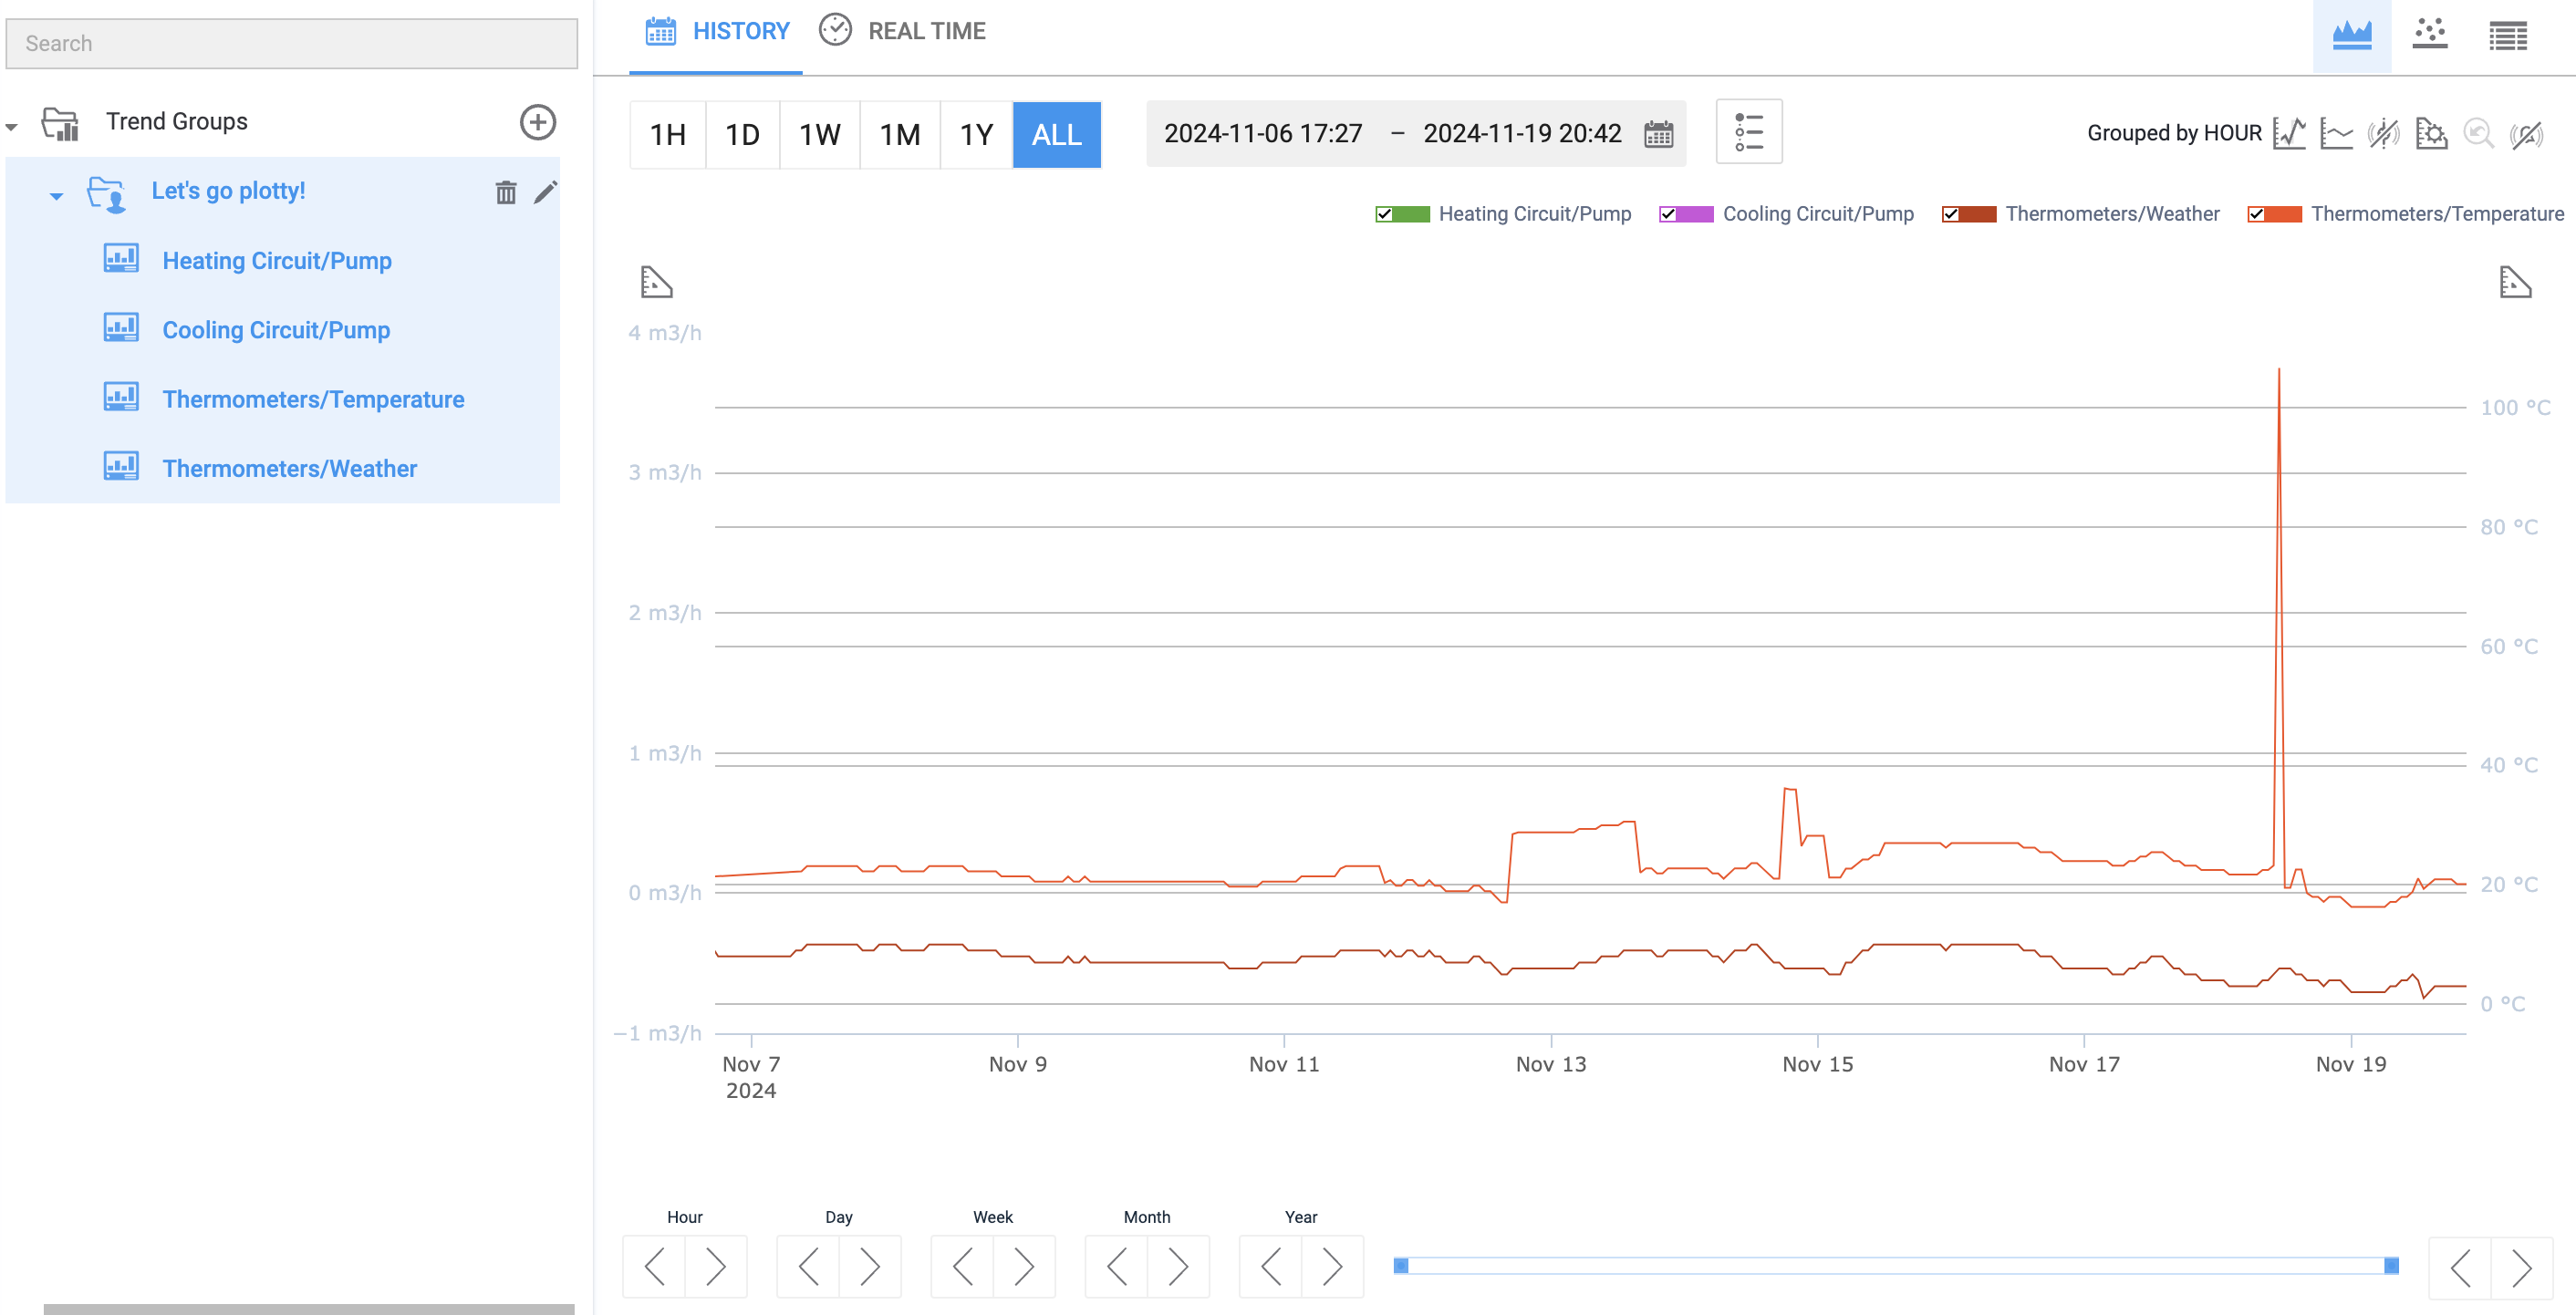
Fig. 15. Here's what a trend group might look like.
To learn other ways to create a trend group and find out how to explore them for data, see Analyze Trends.
OTHER TOOLS…
… can be found in the page viewer that we couldn’t cover in this guide; check them out!ADVANCED
This link leads to a manual written for advanced users.