Extra Tools
HMI has several additional utilities for more advanced management of your site.
Check Logs
HMI automatically keeps timestamped journals of HMI-related events:
- alarm status changes: activations, deactivations, acknowledgement and shelving/unshelving;
- system alerts, e.g., detected hardware failures;
- user activity: tag value updates, new comments, comment edits.
These journals are referred to as logs and are presented in tabular form:
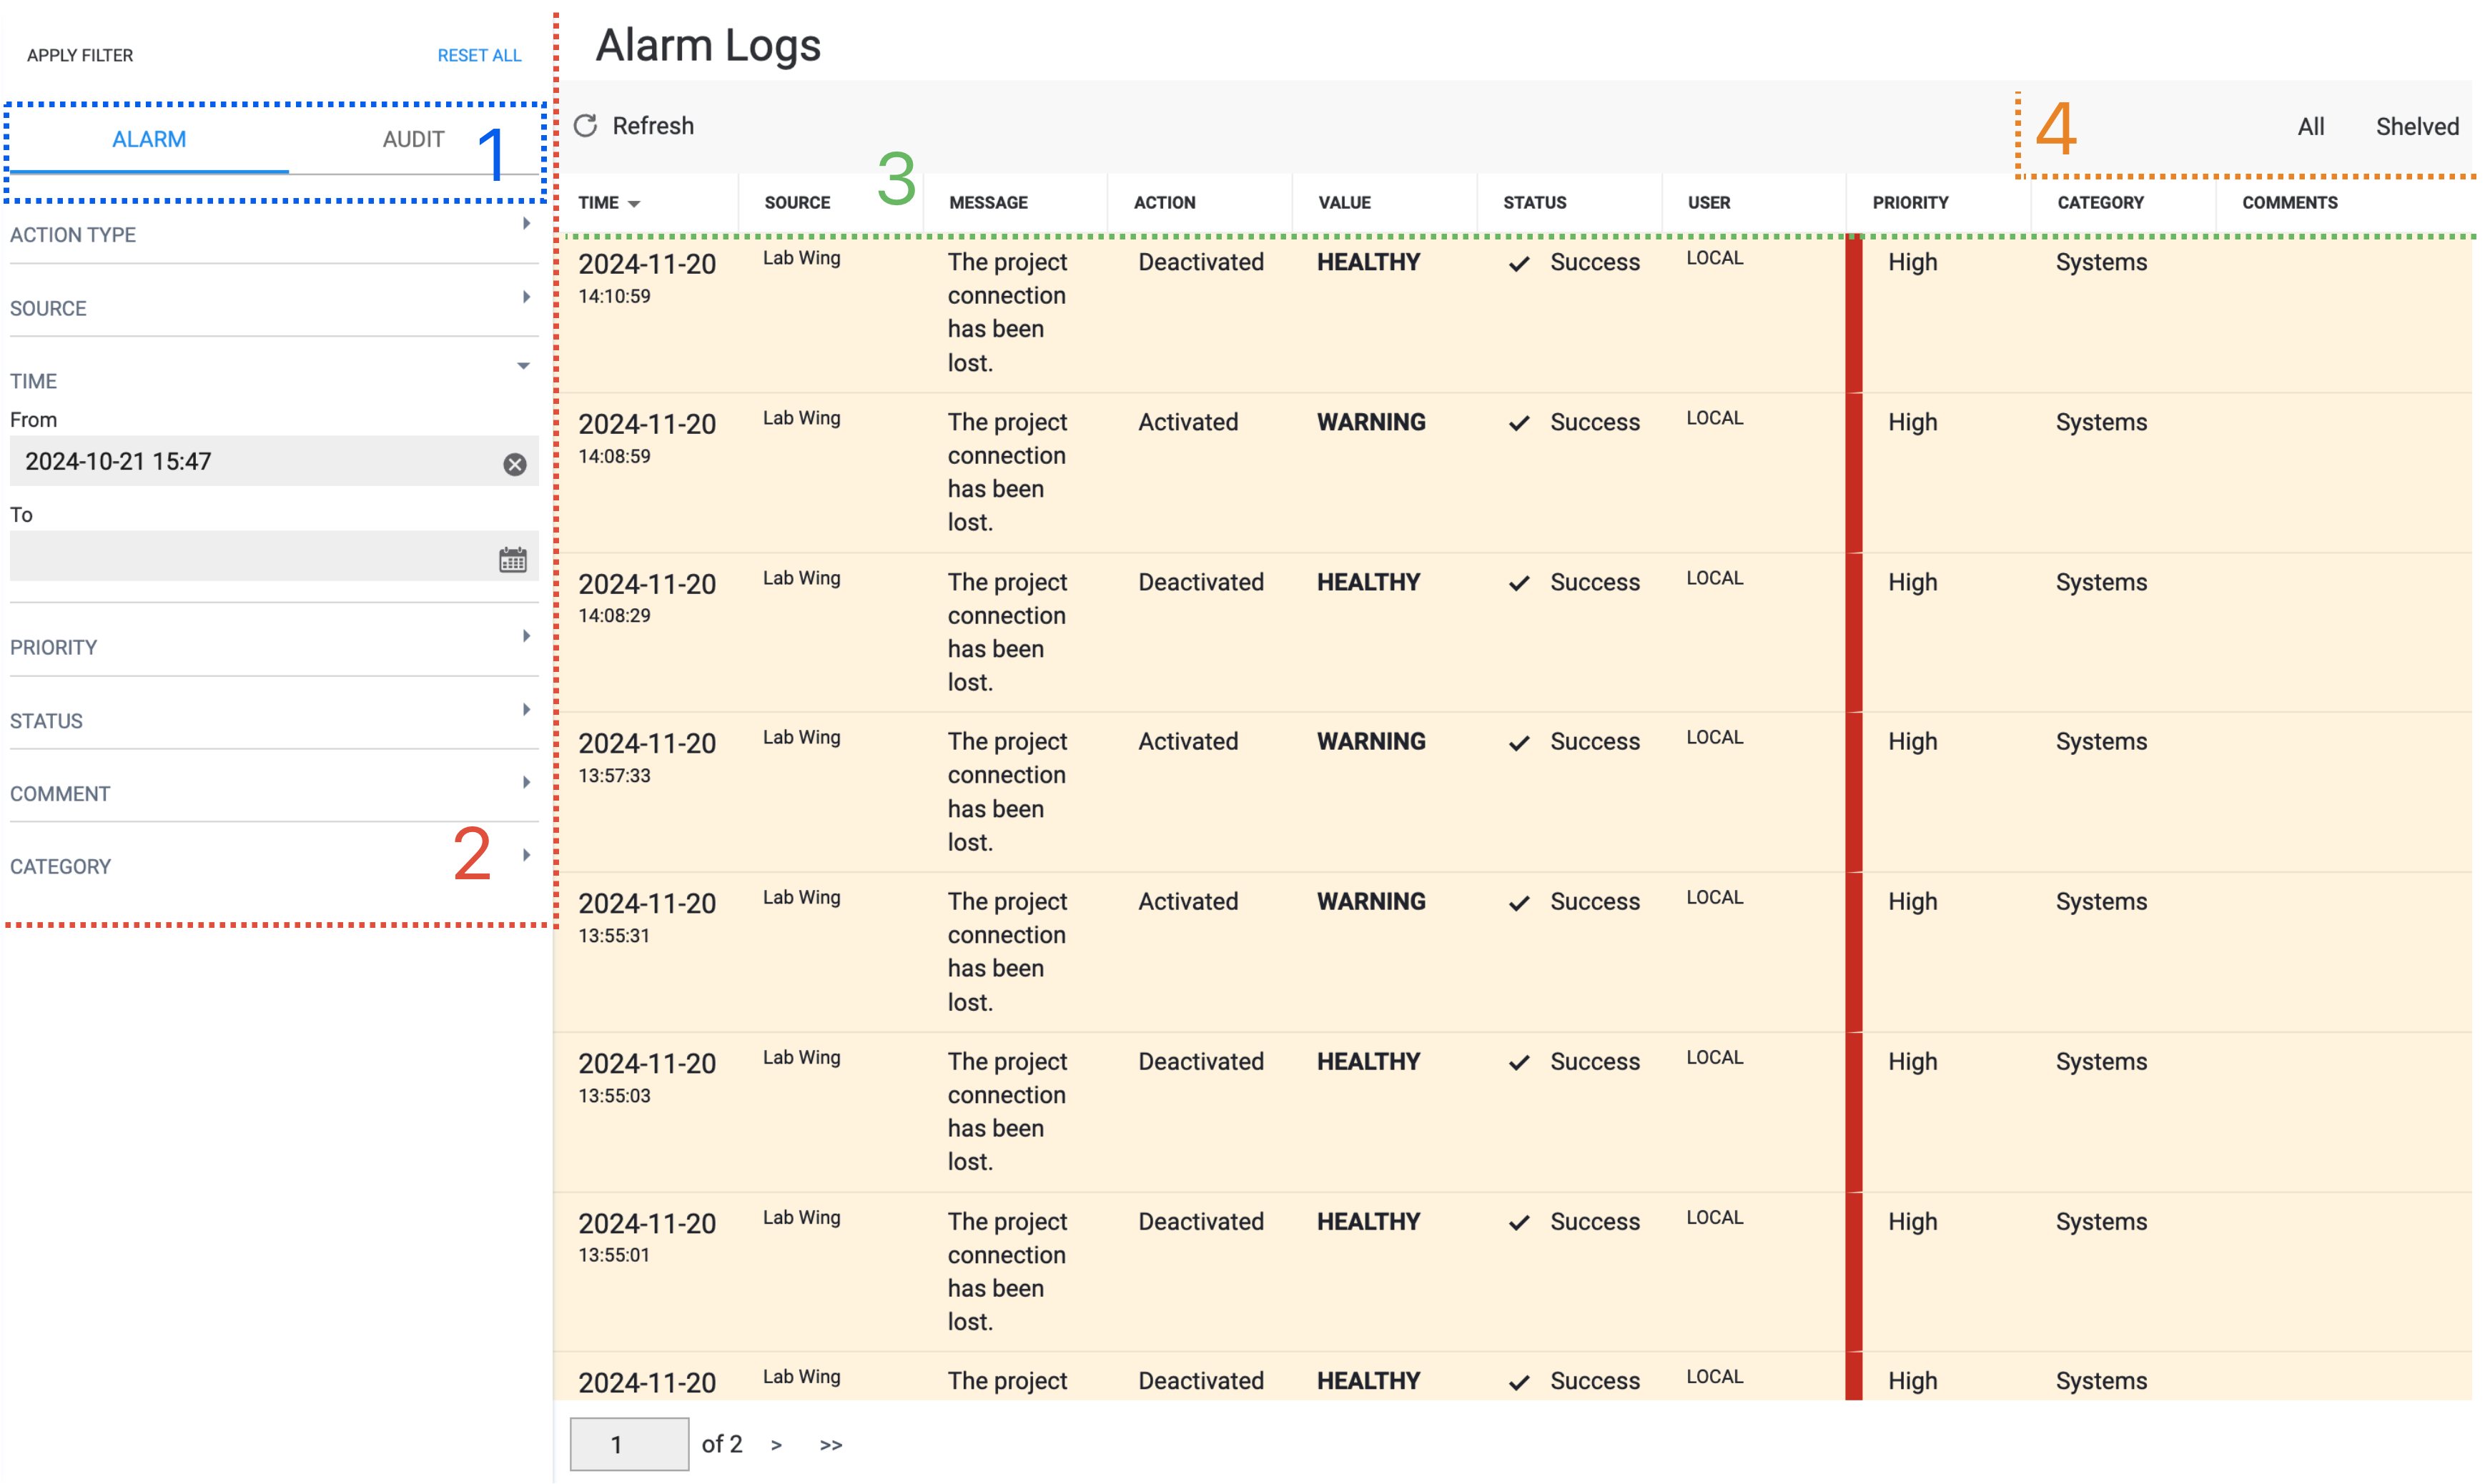
Fig. 1. Logs are basically tables.
This interface has several elements:
-
Two tabs contain two different logs:- for system alerts and alarm status changes
- for user activity
- (expandable)
Metadata-based filters that control what the logs show you. -
Specifies logged parameters. Click on a parameter in the header to toggle sorting in ascending/descending order by that parameter. -
Apply simple filtering presets.
Keep reading what you can do in each of the tabs.
What Happened When
Alarm Statistics provides shortcuts to this interface.
Whenever an alarm changes state, whether because the site’s conditions have changed or a user manually altered it, HMI will log it, and you’ll be able to review what happened later. Same applies to system alerts due to disconnections, hardware failures, and such.
- Where
- »
As you open this log, you’ll see everything the system has ever recorded with respect to alarms. You likely don’t want that, so the log needs to be filtered. So, let’s clean up our view.
-
This filter allows you to select a change of state applied to an alarm. The log will only show entries where the result is the selected state. You cannot select multiple states; however, you can selectAllnot to discriminate, or your selection.1 -
Use the two datetime pickers in this filter to only show log entries recorded during the time period between two dates. -
This filter allows you to select one or more alarm priority levels that you want to see in the log. -
Use this filter if you want to see only entries where alarm state changed or failed to change. You can also selectAllnot to discriminate, or your selection.
After you’ve configured your filters, click on and see the results. Let’s check, for example, which Medium and High priority alarms were successfully acknowledged during the last seven days, i.e., between November 13 and November 20, 2024.
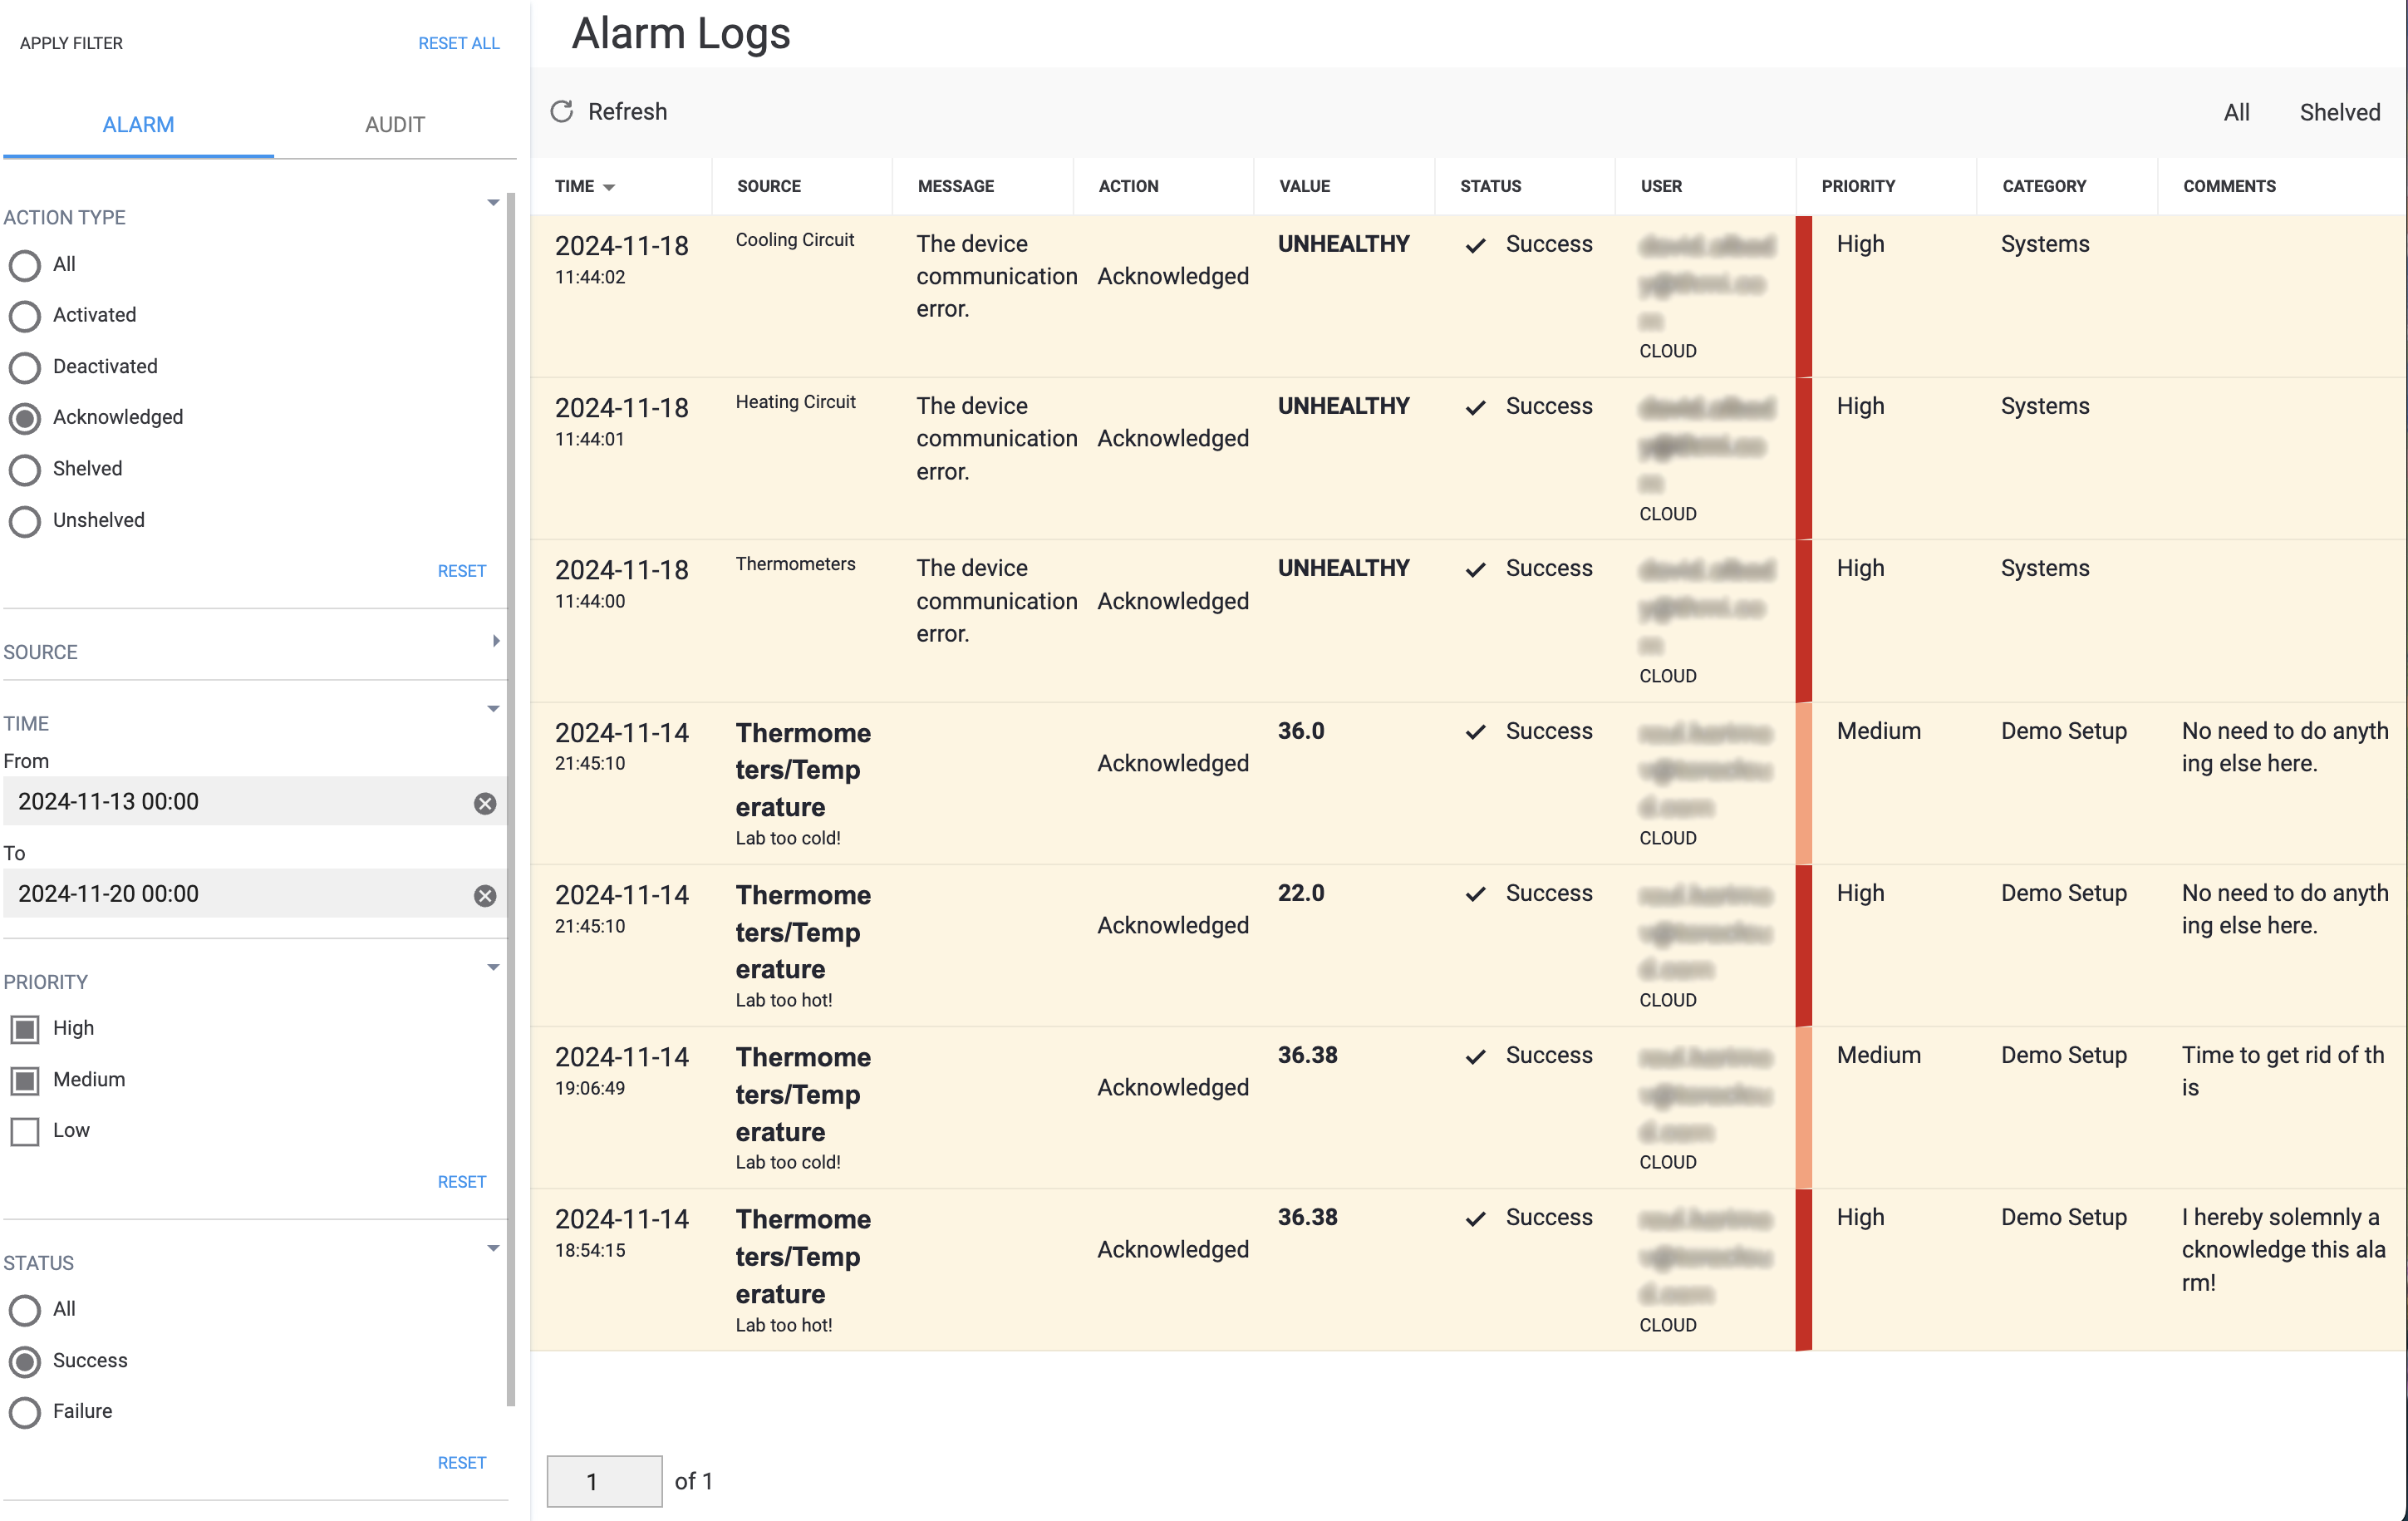
Fig. 2. Filtering results in seeing fewer alarms in the log.
A few fields are of particular interest to us here:
-
In case of an alarm, the source is the alarm’s source tagADVANCED
This link leads to a manual written for advanced users.. In case of a system alert, it can be the name of the deviceADVANCED
This link leads to a manual written for advanced users. that became disconnected, or even the name of the project itself if there was a server failure. -
For alarms, this is the user-configured messageADVANCED
This link leads to a manual written for advanced users.. System alerts come with a preprogrammed error message indicating what happened. -
In case of an alarm, shows the value of its source tag at the moment of status change. In case of a system alert, shows the system-provided status of the affected component. -
This is the username of the person who applied this or that particular action. It contains a suffix that shows where the action was applied from:- CLOUD if the HMI was accessed from the Cloud;
- LOCAL if local HMI was used.
-
If action was applied with a comment, its text will be visible here.
By default, the log entries are sorted by time, from newest to oldest. You can, however, sort by any other parameter simply by clicking on its name in the header.
Now we can apply some other filters and click on again to use the new configuration. Alternatively, you can filters, which will immediately revert the log back to its original state.
Further Reading
If you want to learn more about how alarms work, what their states mean, and what actions user can apply to alarms, Handle Alarms is a great starting point.
Who Did What
In some cases, you may also want to see what the users have been doing with your project outside alarm-related activities. Logs record that, too!
- Where
- »
Similarly to the log, you’ll find filters here that you can use to restrict the log entries shown to a particular set of parameters.
-
This filter produces a log that only shows the selected user actions, to see, for example, when and who wrote values to tags or added their comments. You can select one or more actions you want to see,Allnot to discriminate, or your selection.-
Update Valueaffects only tags. -
Comment,Edit Comment,Delete Commentconcern page comments and alarm comments.
-
-
This filter narrows the log down to the entries about the specified user’s actions. Note that you need to enter their exact username (email address) here; partially entered names or regular expressions will not work. -
An action can target any of the project’s assets: pages, tags, or alarms, one at a time. To see entries specifically about one particular asset, enter its full name here. Note that it must, again, be an exact name.
For other filtering options, refer to the previous section.
Once you’ve configured your filter, click on and see the results. Let’s check, for example, who successfully wrote values to tags between November 13 and November 20, 2024:
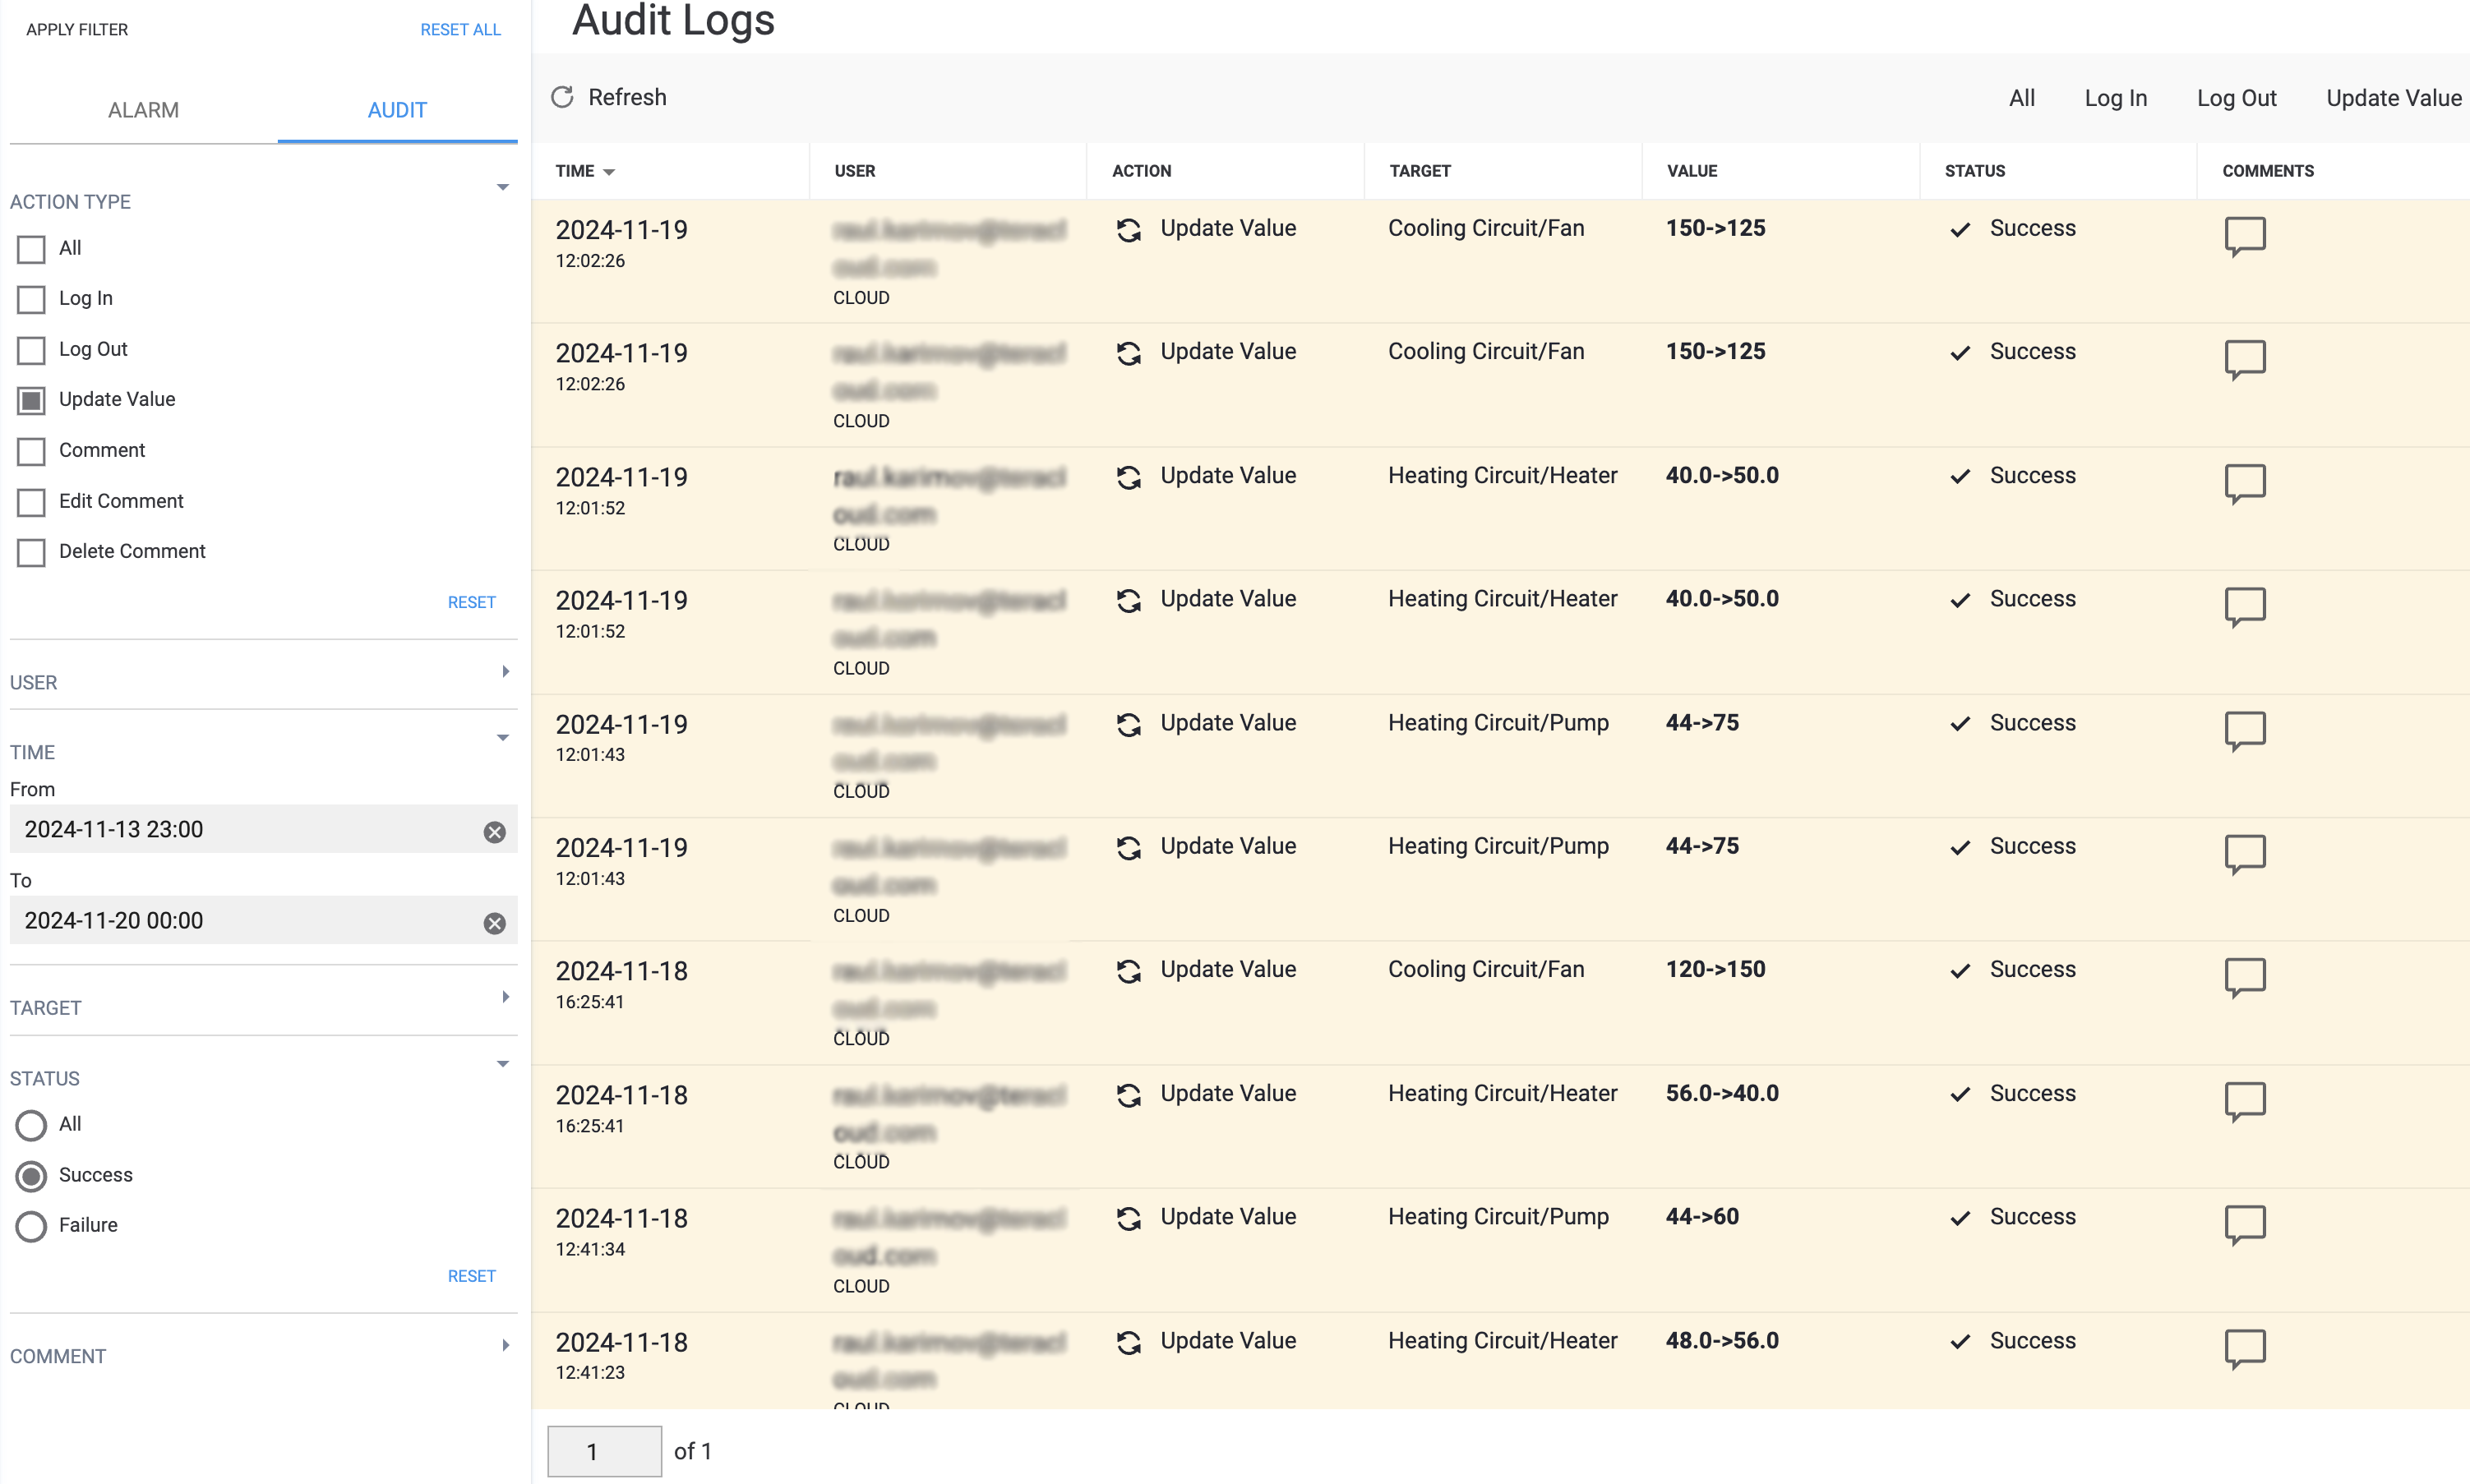
Fig. 3. You can be even more specific in what you want to see in the logs.
There are three columns of interest to us here:
-
See the previous section. -
Name of the affected project asset: tag, page, or alarm. -
Change of value resulting from the user’s action (tags only).
For other columns, refer to the previous section.
What Else?
View docs
If you have access to documents uploaded to your project, you’ll find them in . These files are organized into expandable folders and can be viewed directly in the HMI using the browser-based viewer:
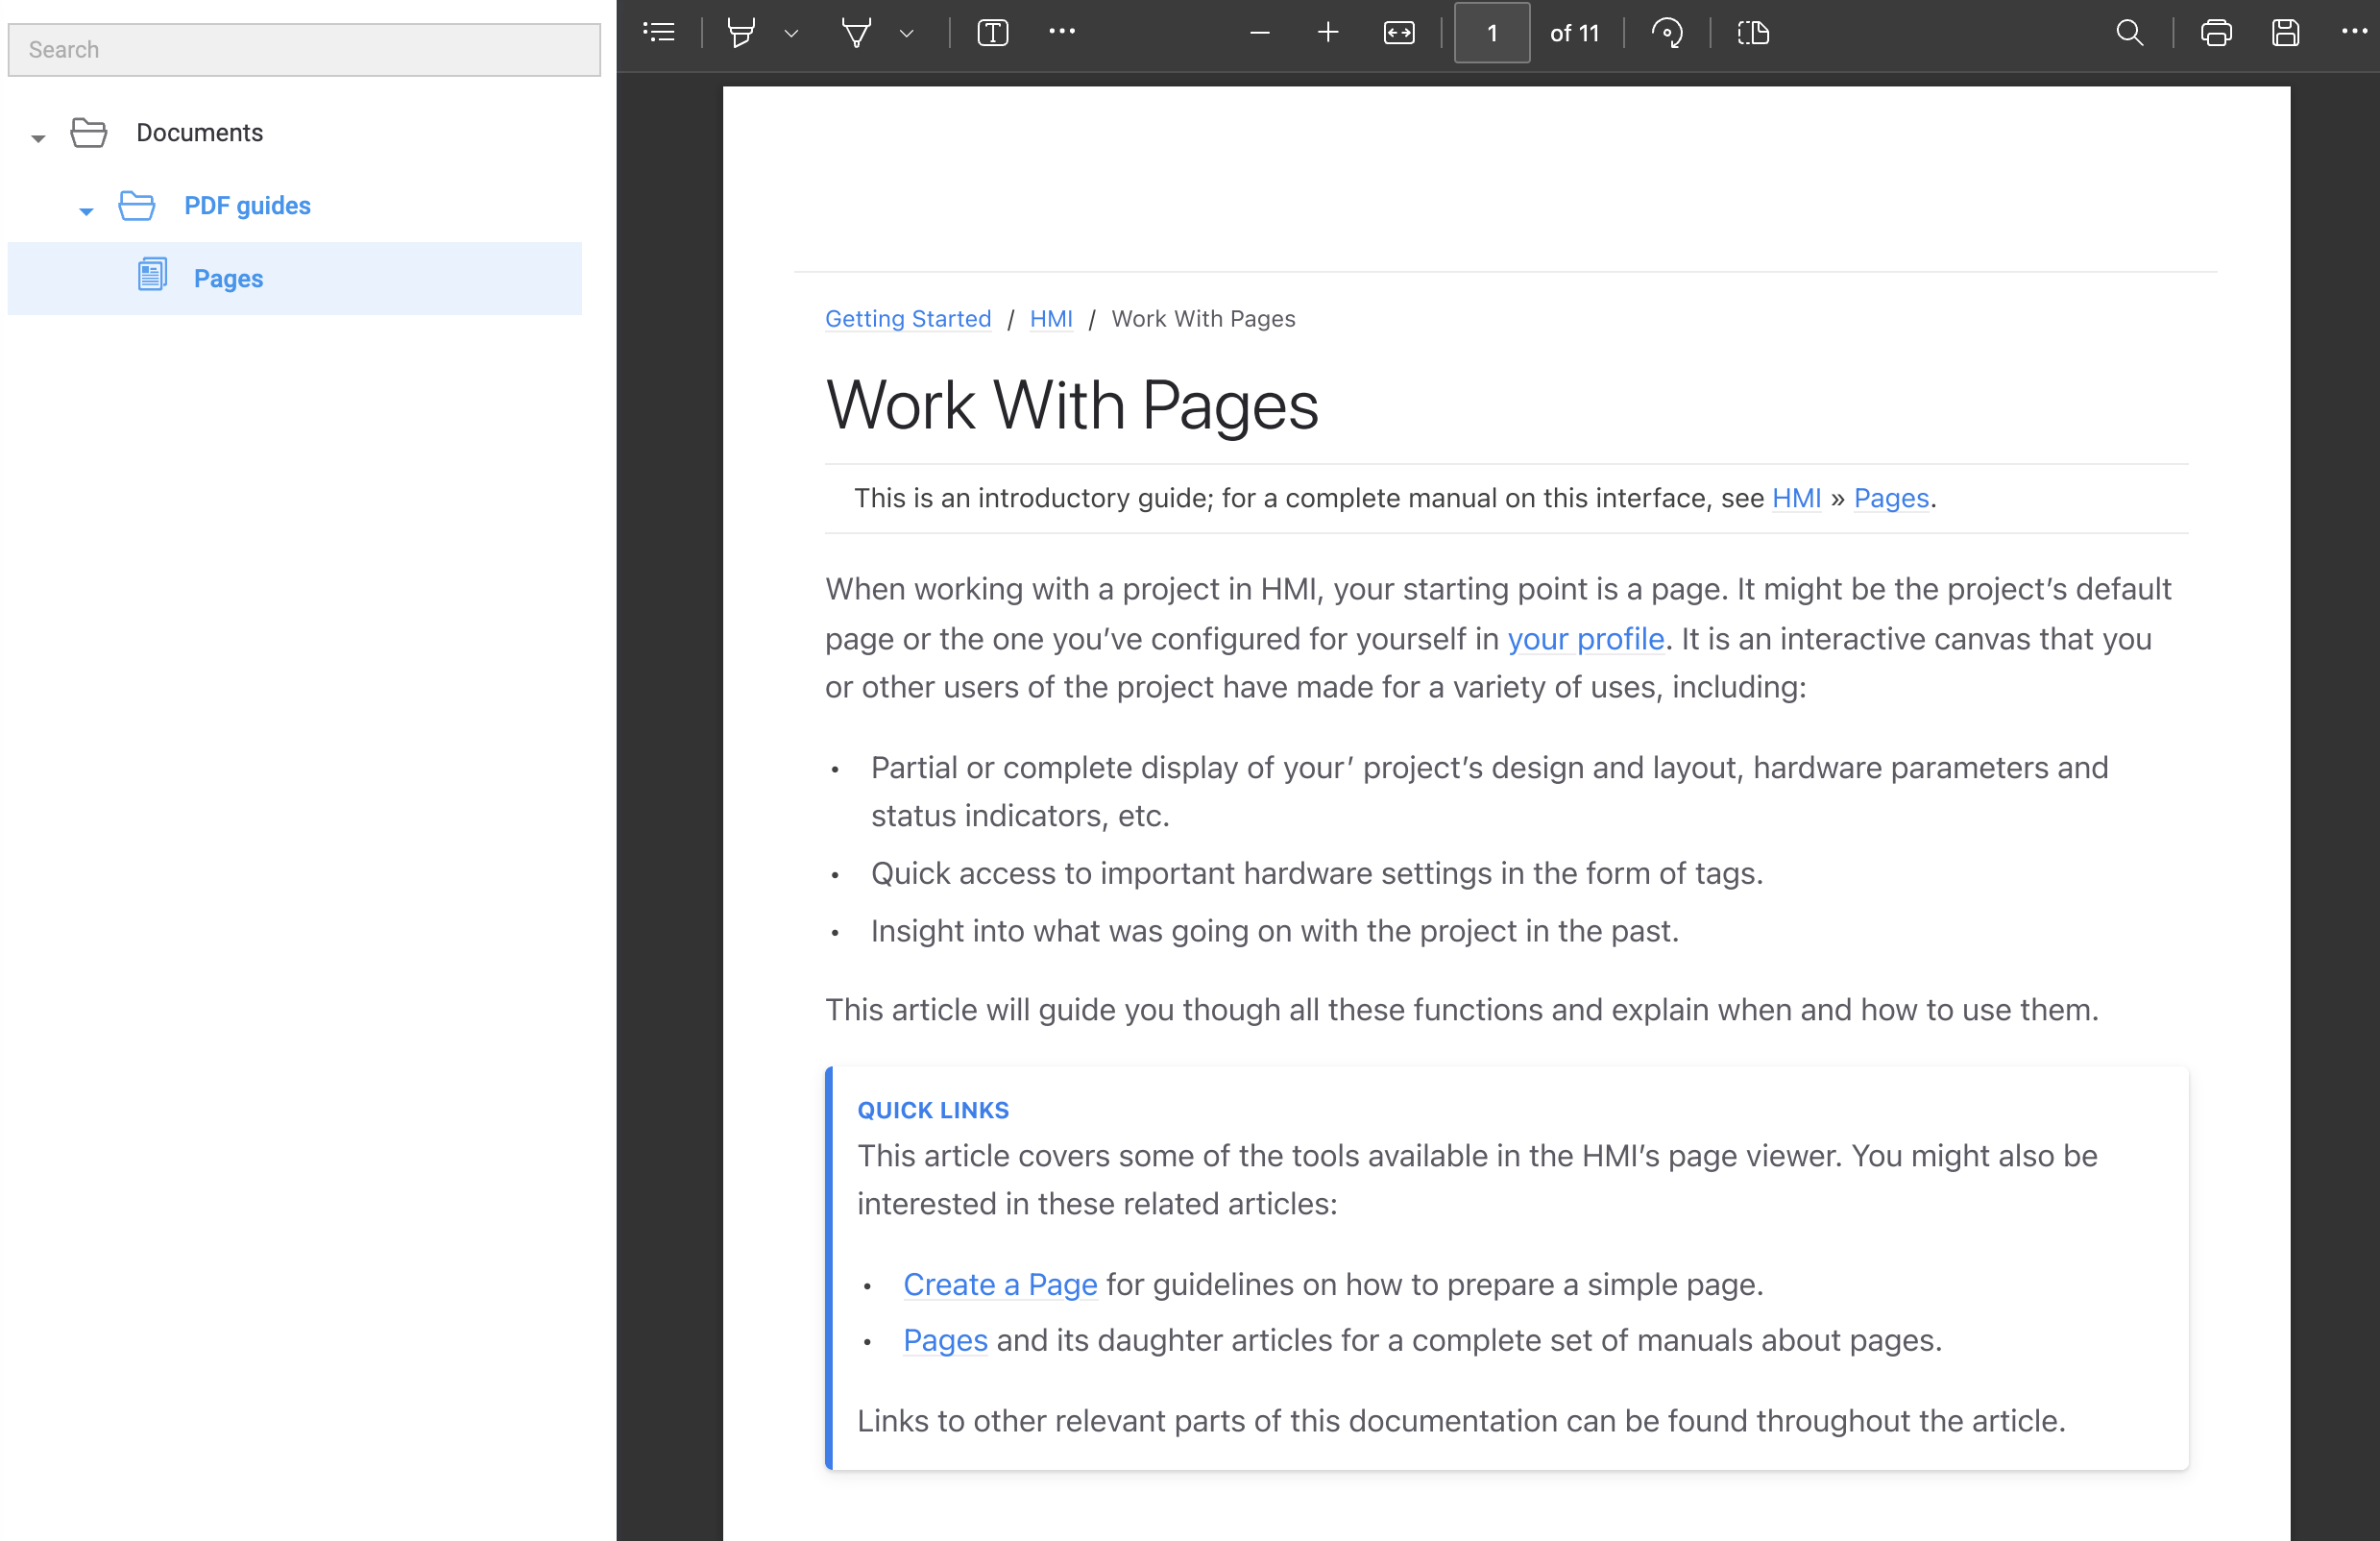
Fig. 4. PDF files can be viewed directly in the browser.
Keep up with events
If the project has ongoing, past, or future eventsScheduled changes in the values of writable tags, they can be seen on the calendar of .
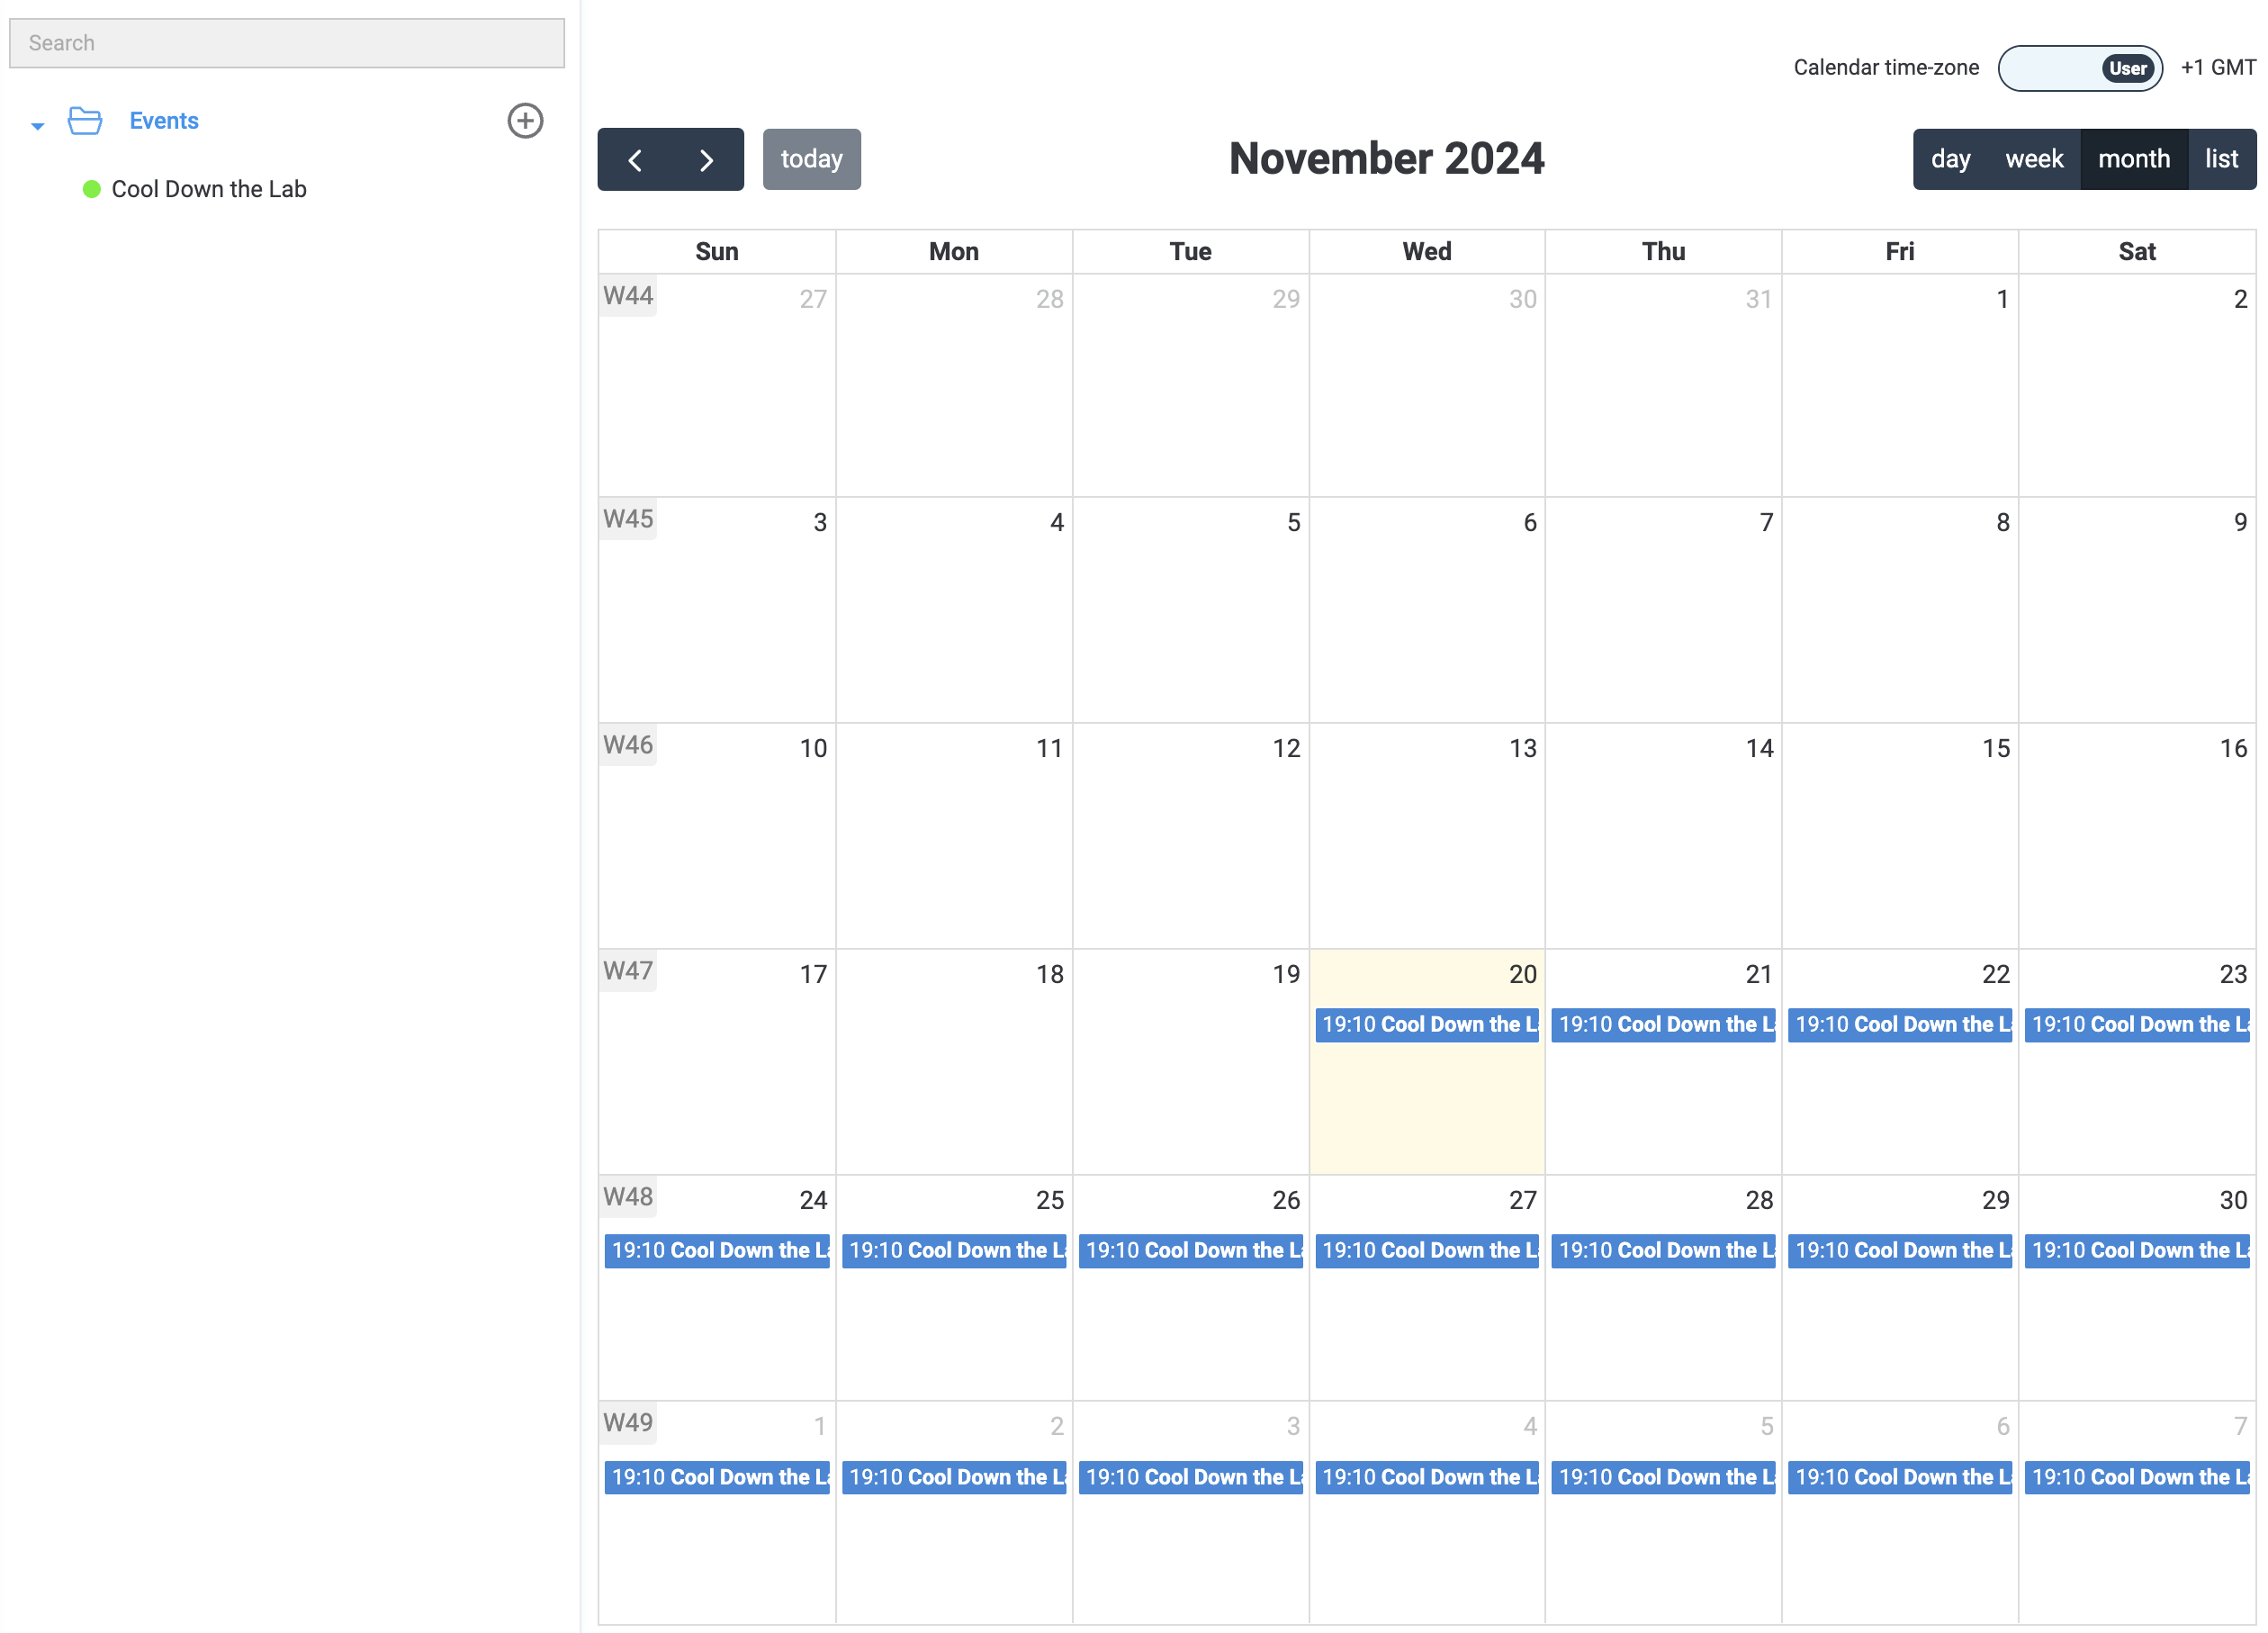
Fig. 5. Scheduled events can be seen and managed with the HMI's calendar.
For more details about how to schedule an event and what options you have for viewing them, see EventsADVANCED
This link leads to a manual written for advanced users..
Note that :
Acknowledgedcan change the state of an alarm to bothand; these are not differentiated in the logs. ↩